Quickstart for the dbt Cloud Visual Editor
Introduction
The Visual Editor is currently in a limited beta. Contact us if you're interested in joining it. Features currently in the beta are subject to change or removal.
The dbt Cloud Visual Editor offers a quick and straightforward way for anyone to build analytics models, no background in analytics engineering required! In this guide, you will learn about:
- Accessing the Visual Editor and creating a new model
- How to navigate the interface
- How to build a model using operators
- How to commit your changes to Git
- Locating your Visual Editor model and data
Prerequisites
To use the Visual Editor, you must meet the following prerequisites:
- Your account must have the following configured:
- A data warehouse connection
- Integration with a Git provider
- Source models for the Visual Editor must have been run at least once
- You must have a
developerlicense - You must have credentials configured for your data warehouse and Git provider in the Your profile section of the Account settings.
The examples in this guide use the Jaffle Shop GitHub repo sample project. You can use your data, but the Jaffle Shop offers a full-featured project useful for testing dbt features. Ask your dbt Cloud administrator about importing it to a project in your environment. They must also execute dbt run on the Jaffle Shop project before you begin, or you will be unable to reference the source models.
Access the Visual Editor
To access the Visual Editor:
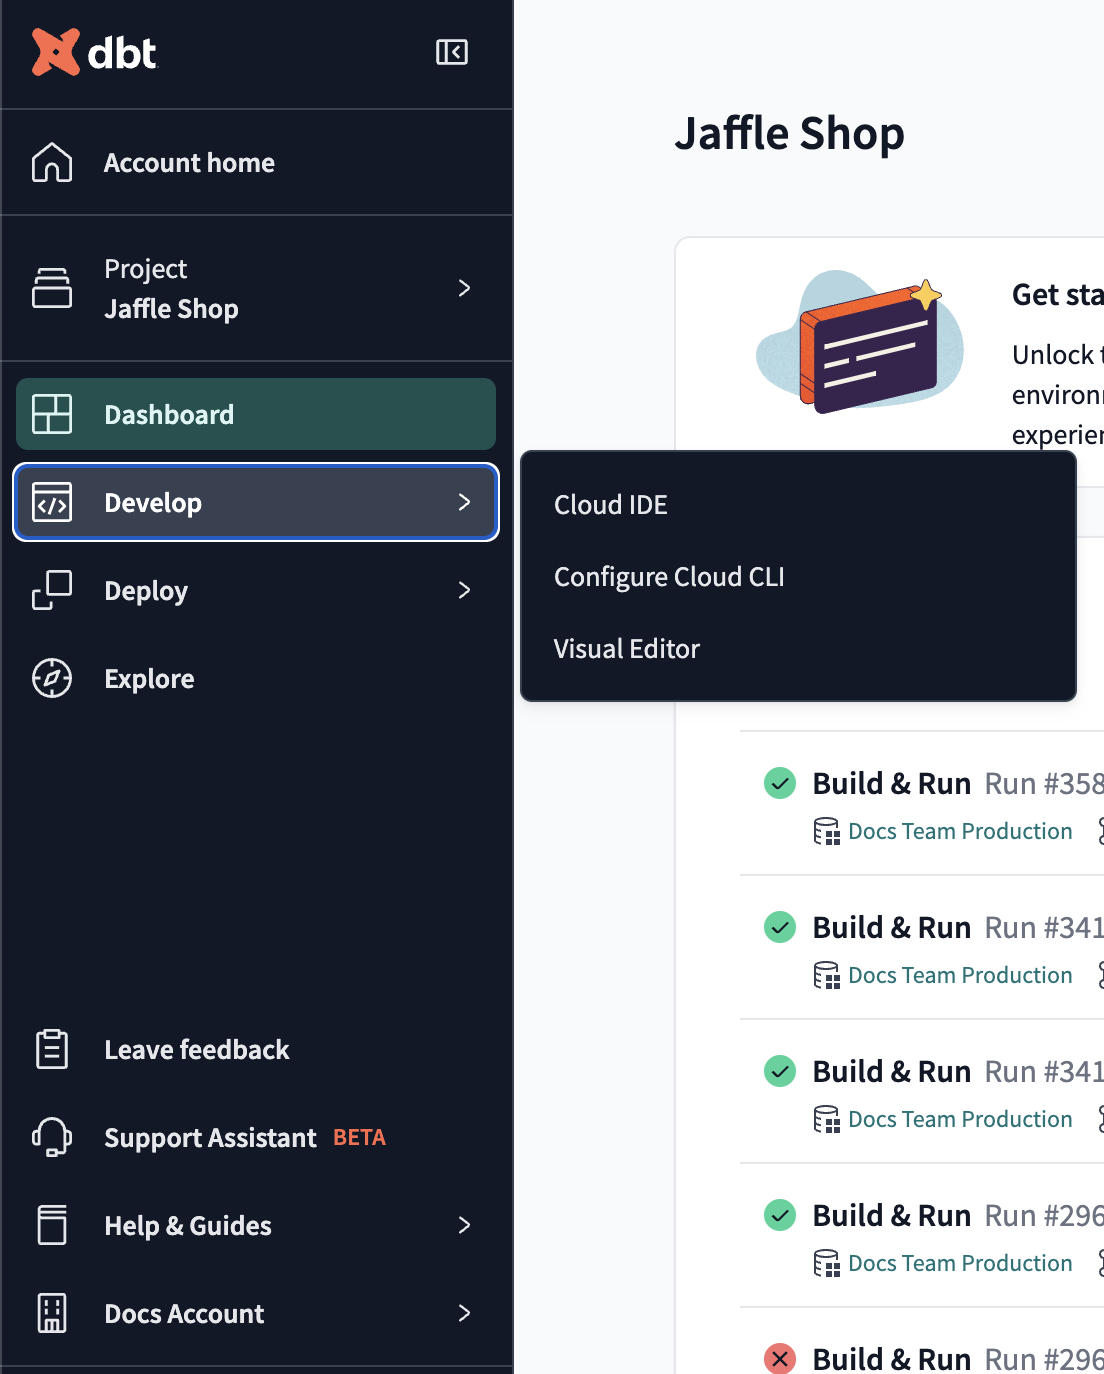
- Click Develop from the main menu. If you do not see the Develop option, ensure you have selected a Project from the menu.
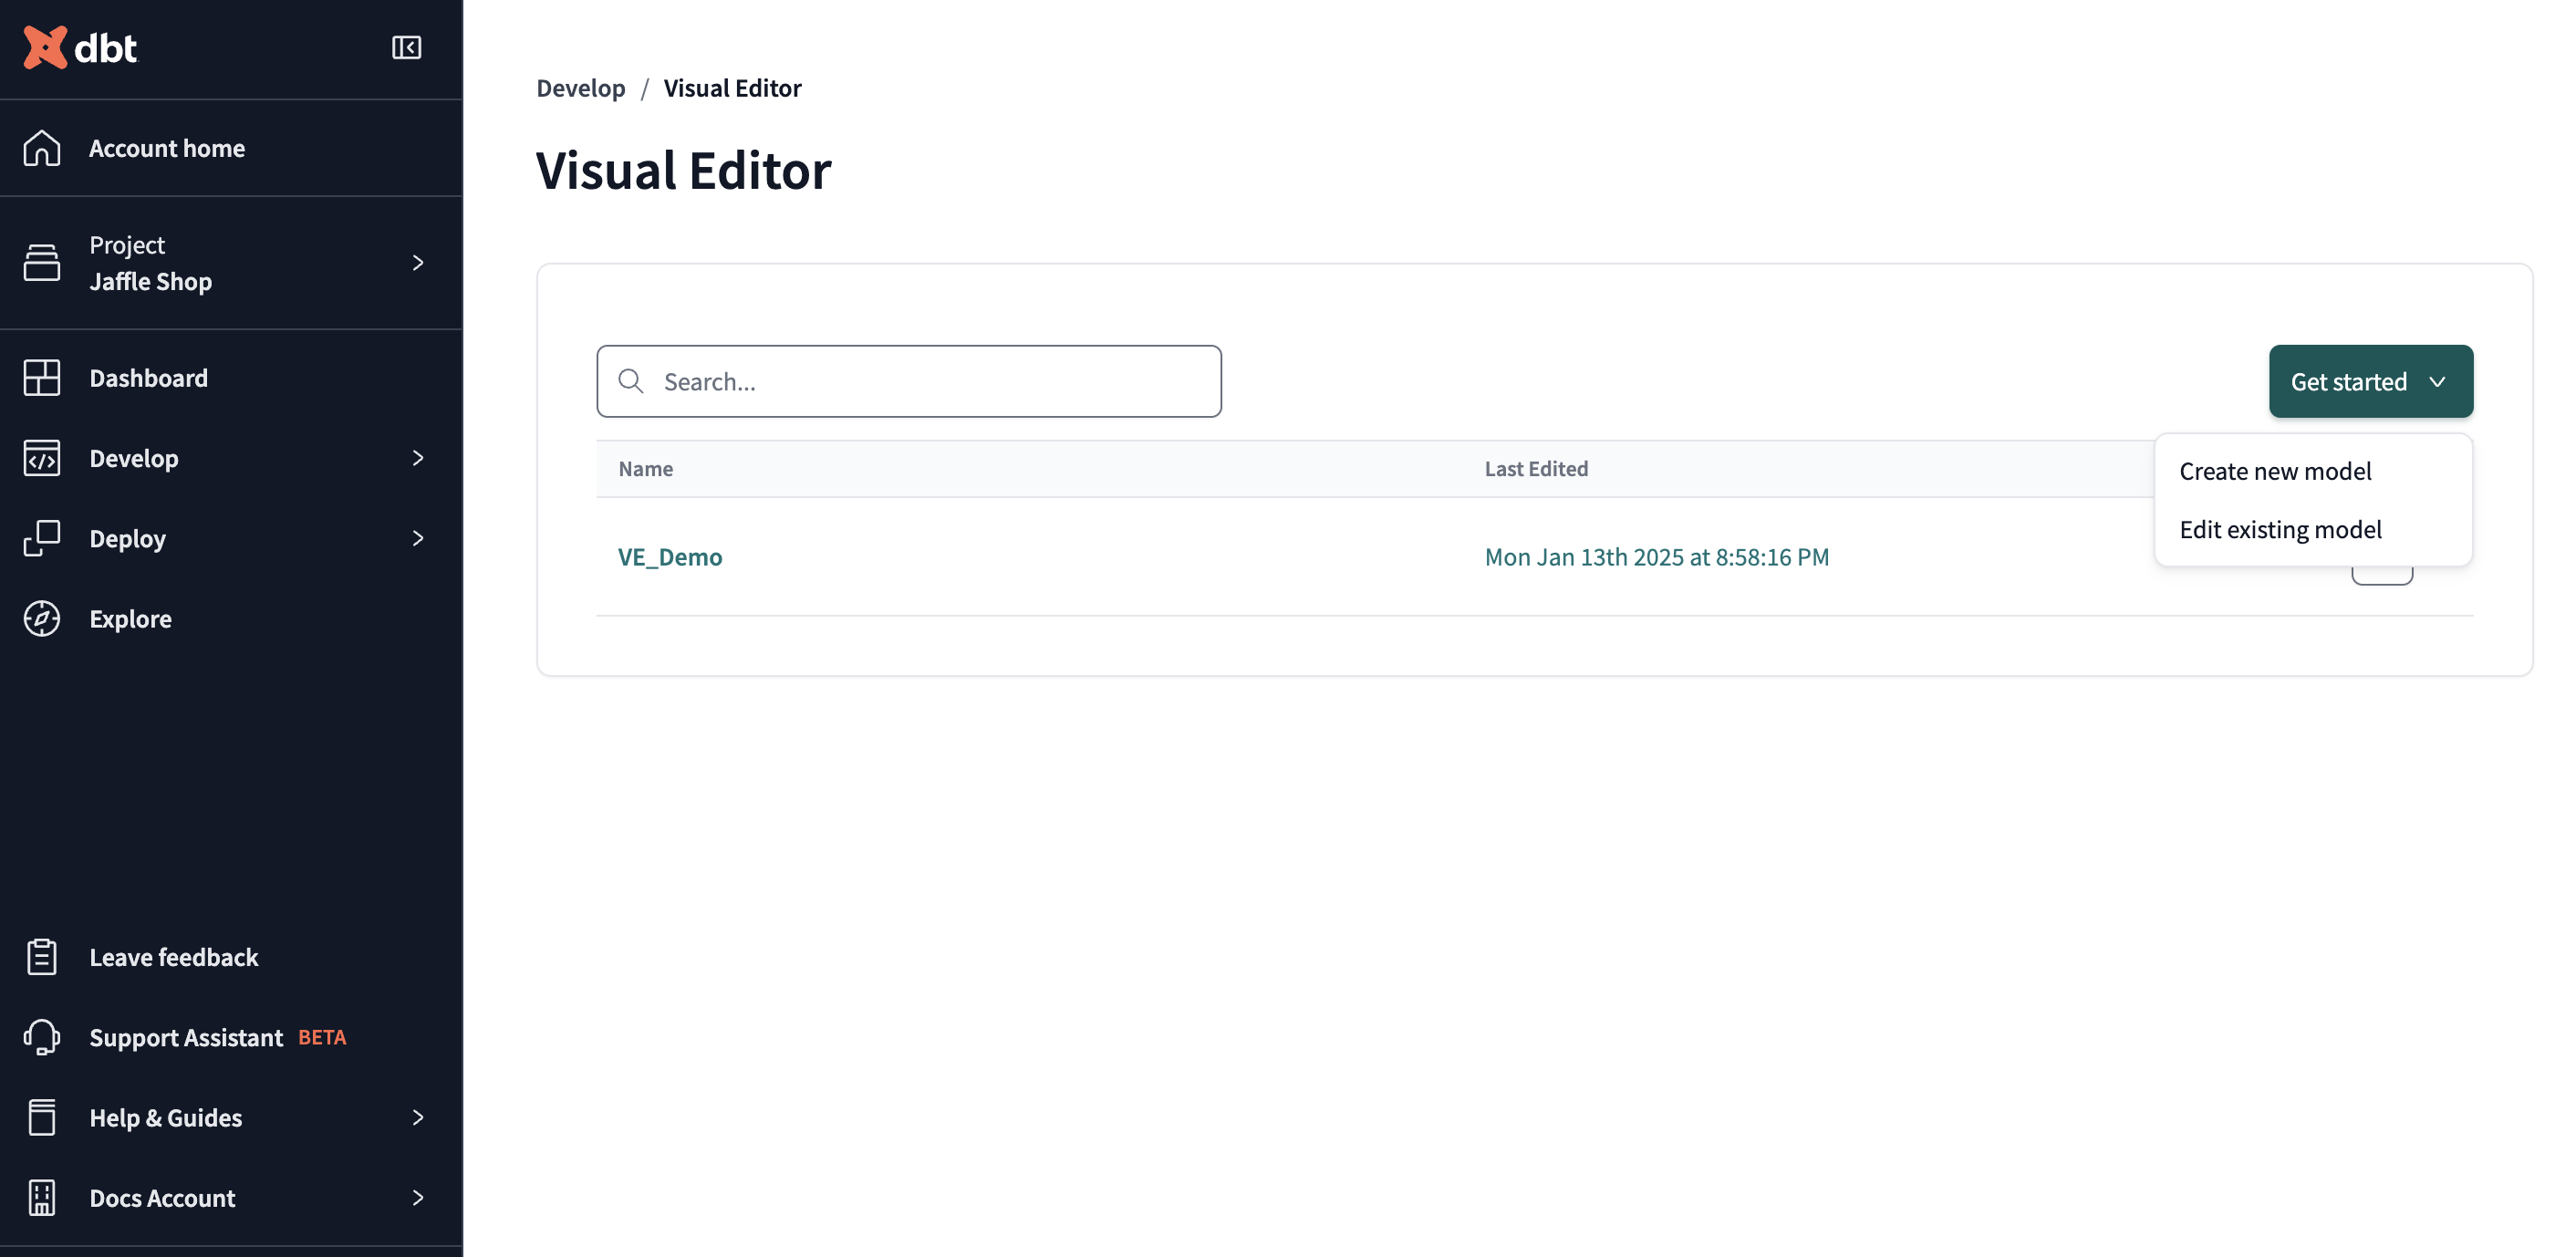
- Click Visual Editor.
- From the right side, click Get started and then click Create new model.
Navigating the interface
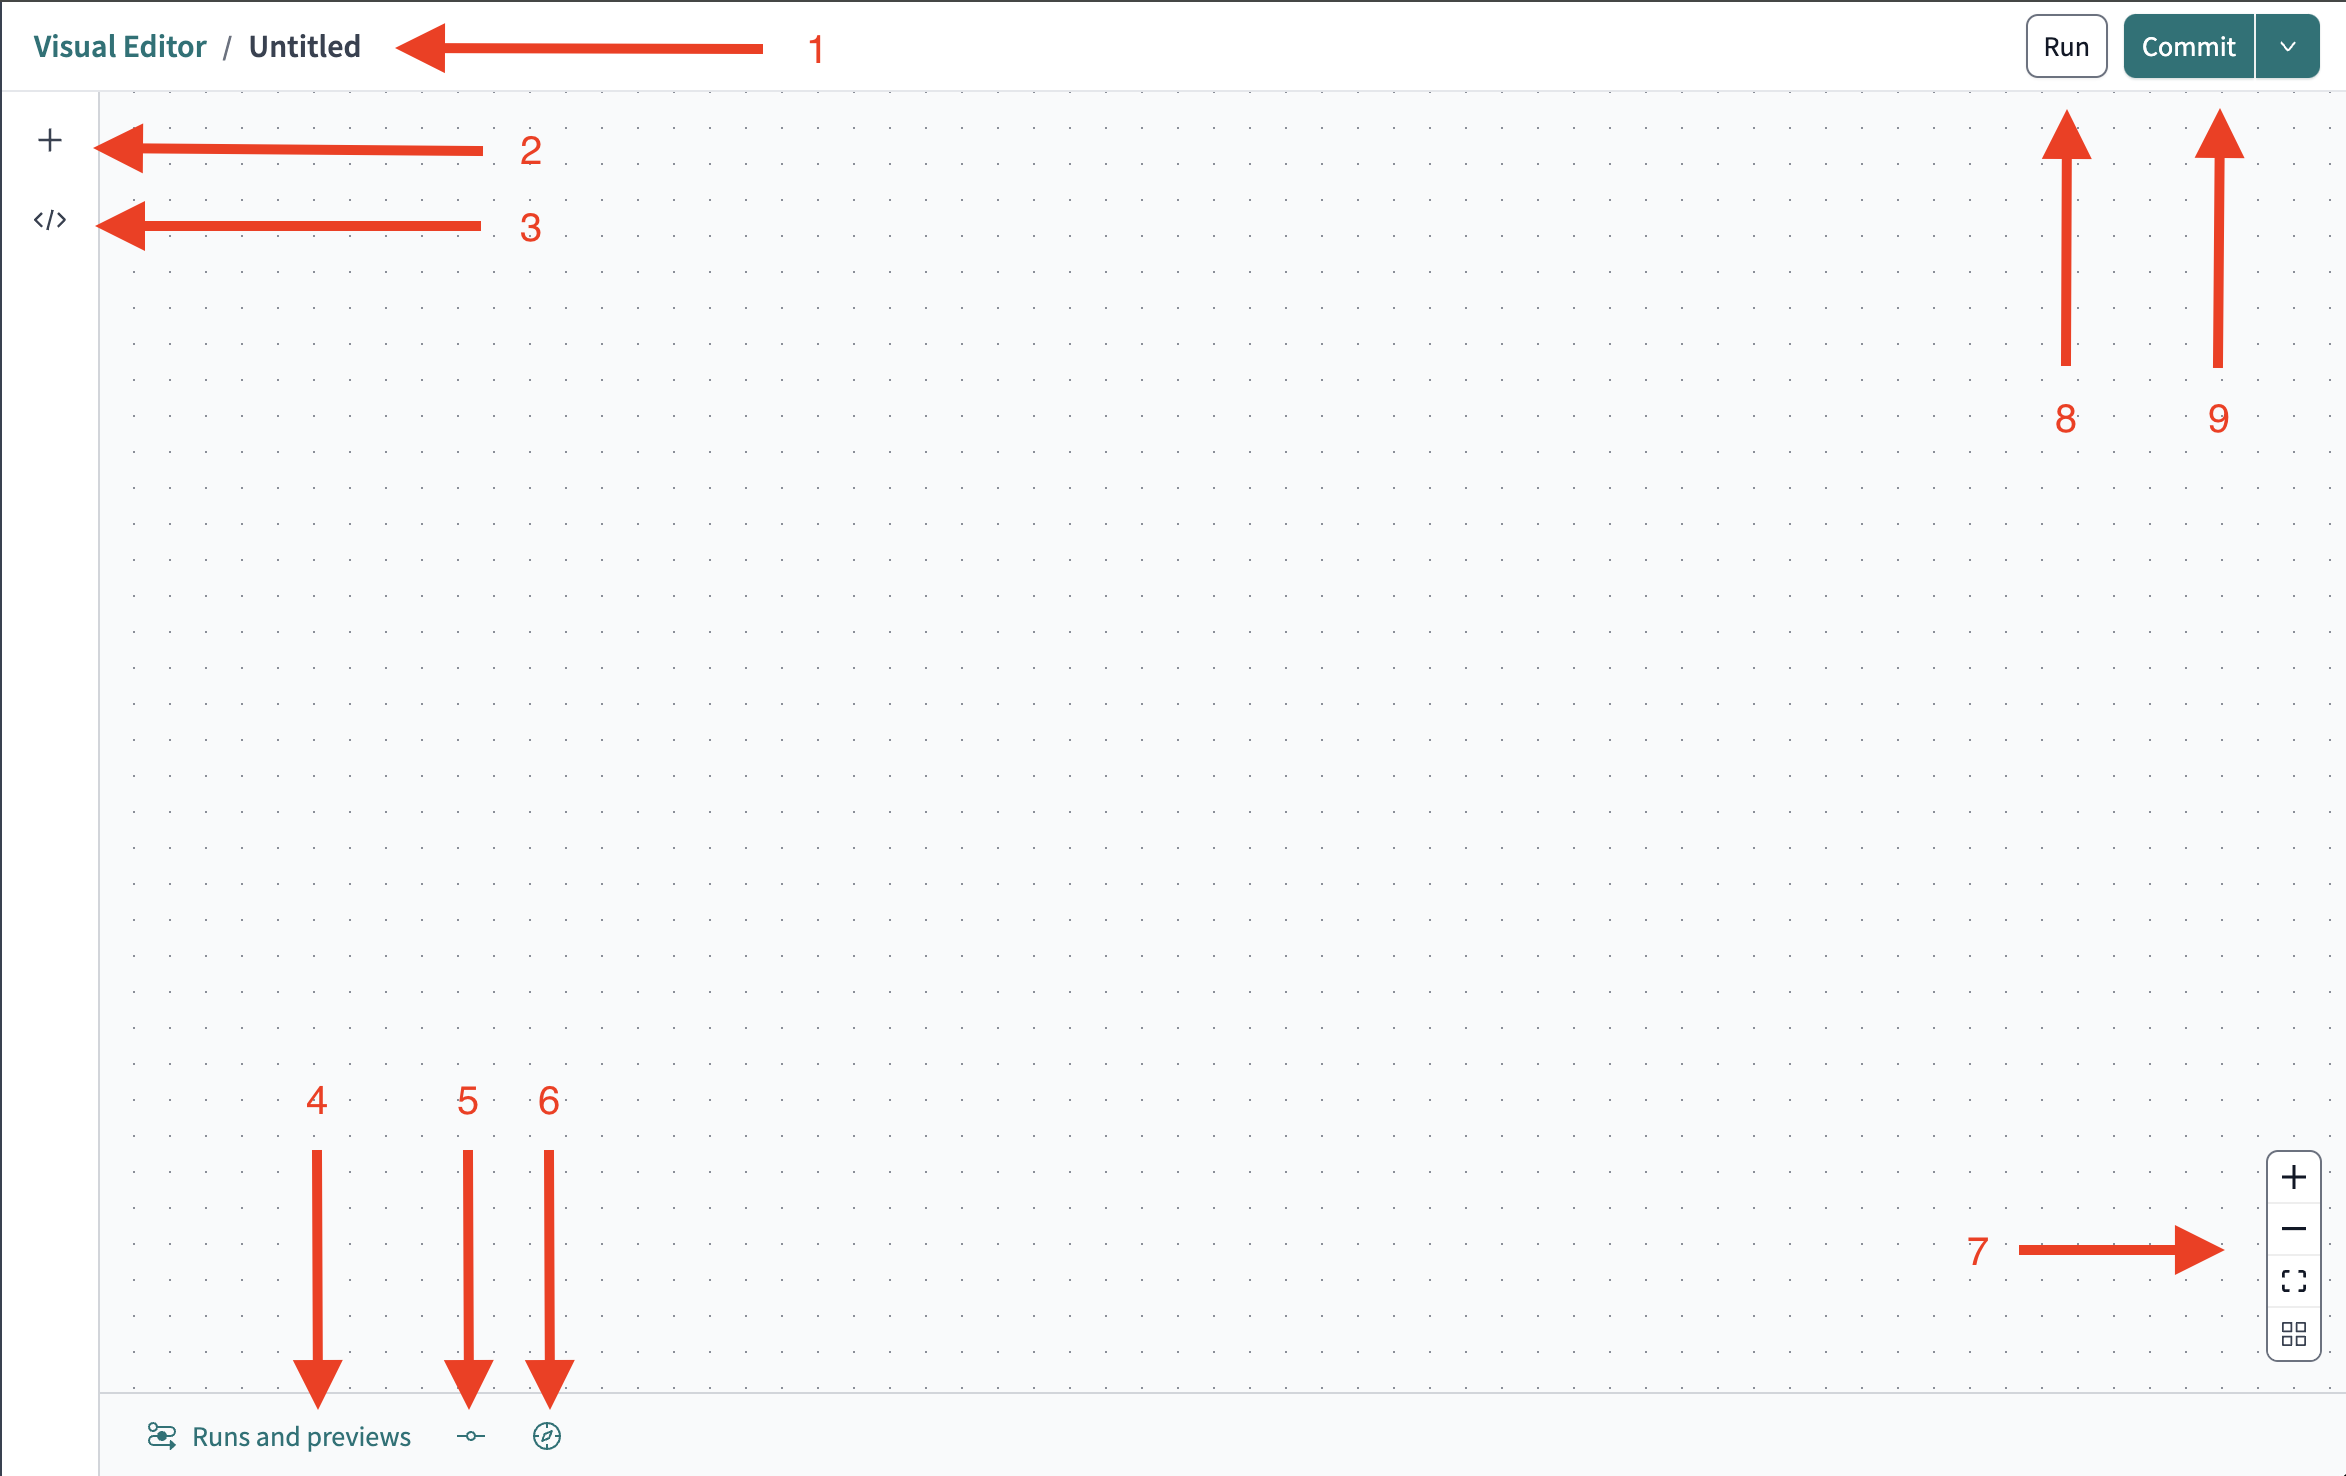
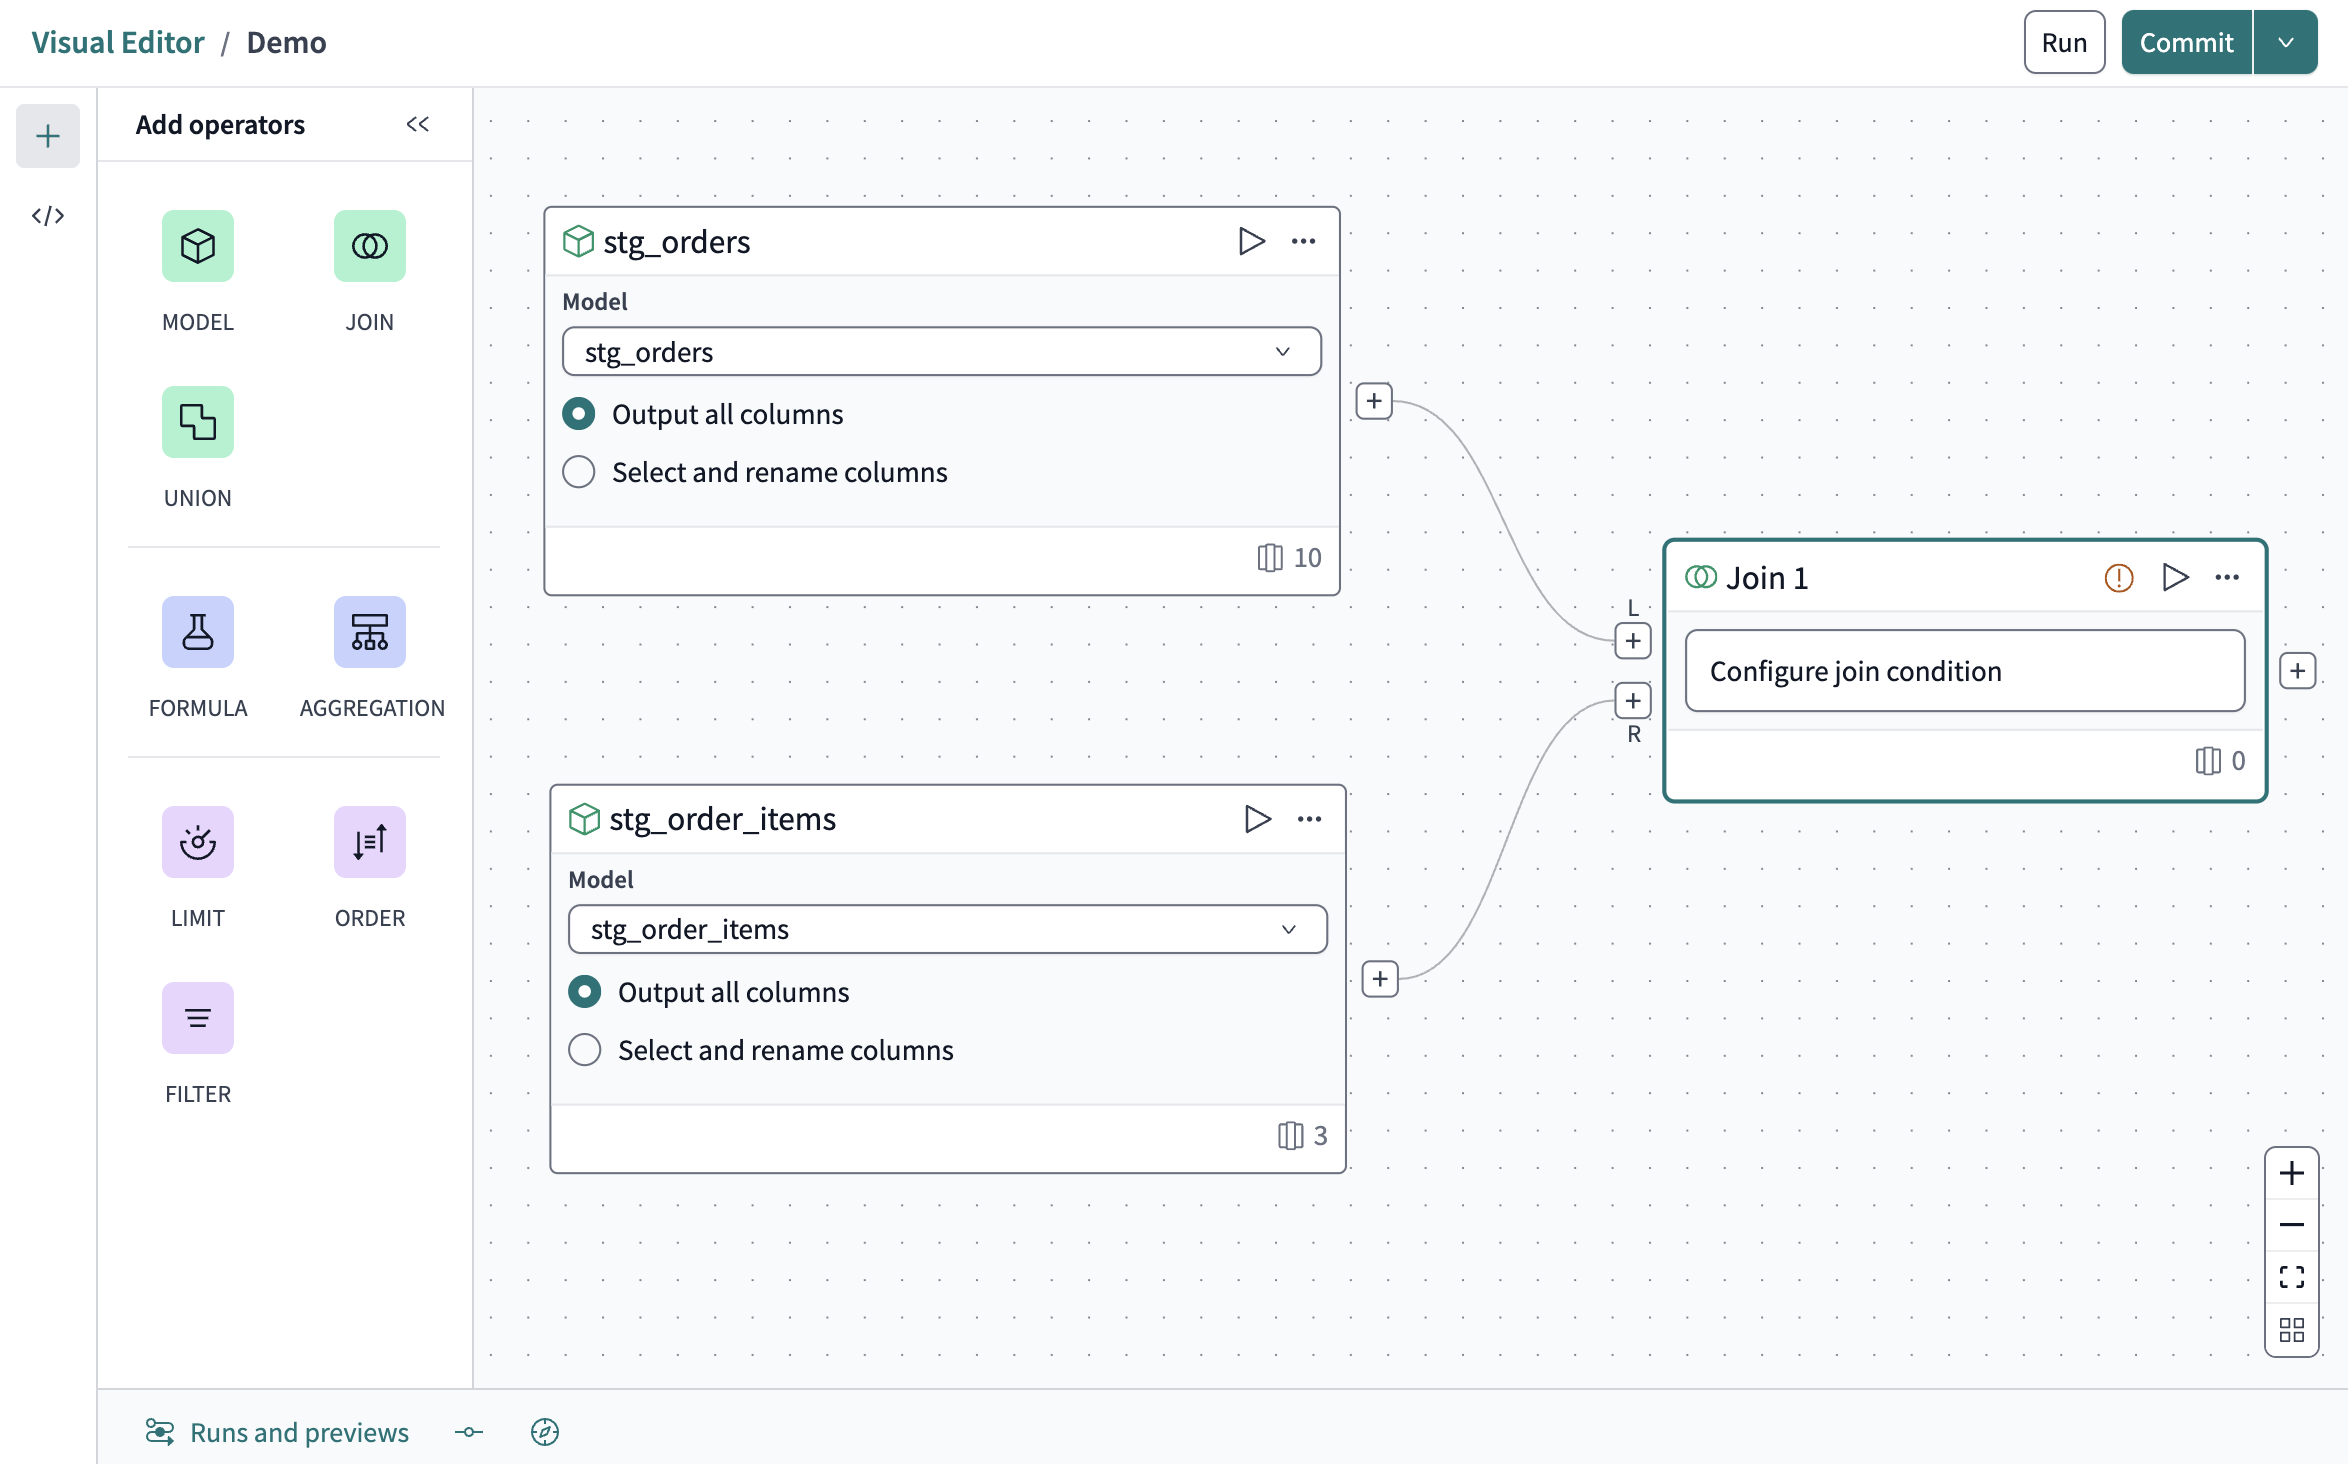
The Visual editor comprises a series of menus activated by clicking icons surrounding the border of the larger canvas. With none of the menu items activated, the workspace looks like this:
Click on an icon to expand its section or execute an action depending on its purpose. The options are as follows:
- The model's title. This defaults to "Untitled" but can be edited anytime by clicking on it.
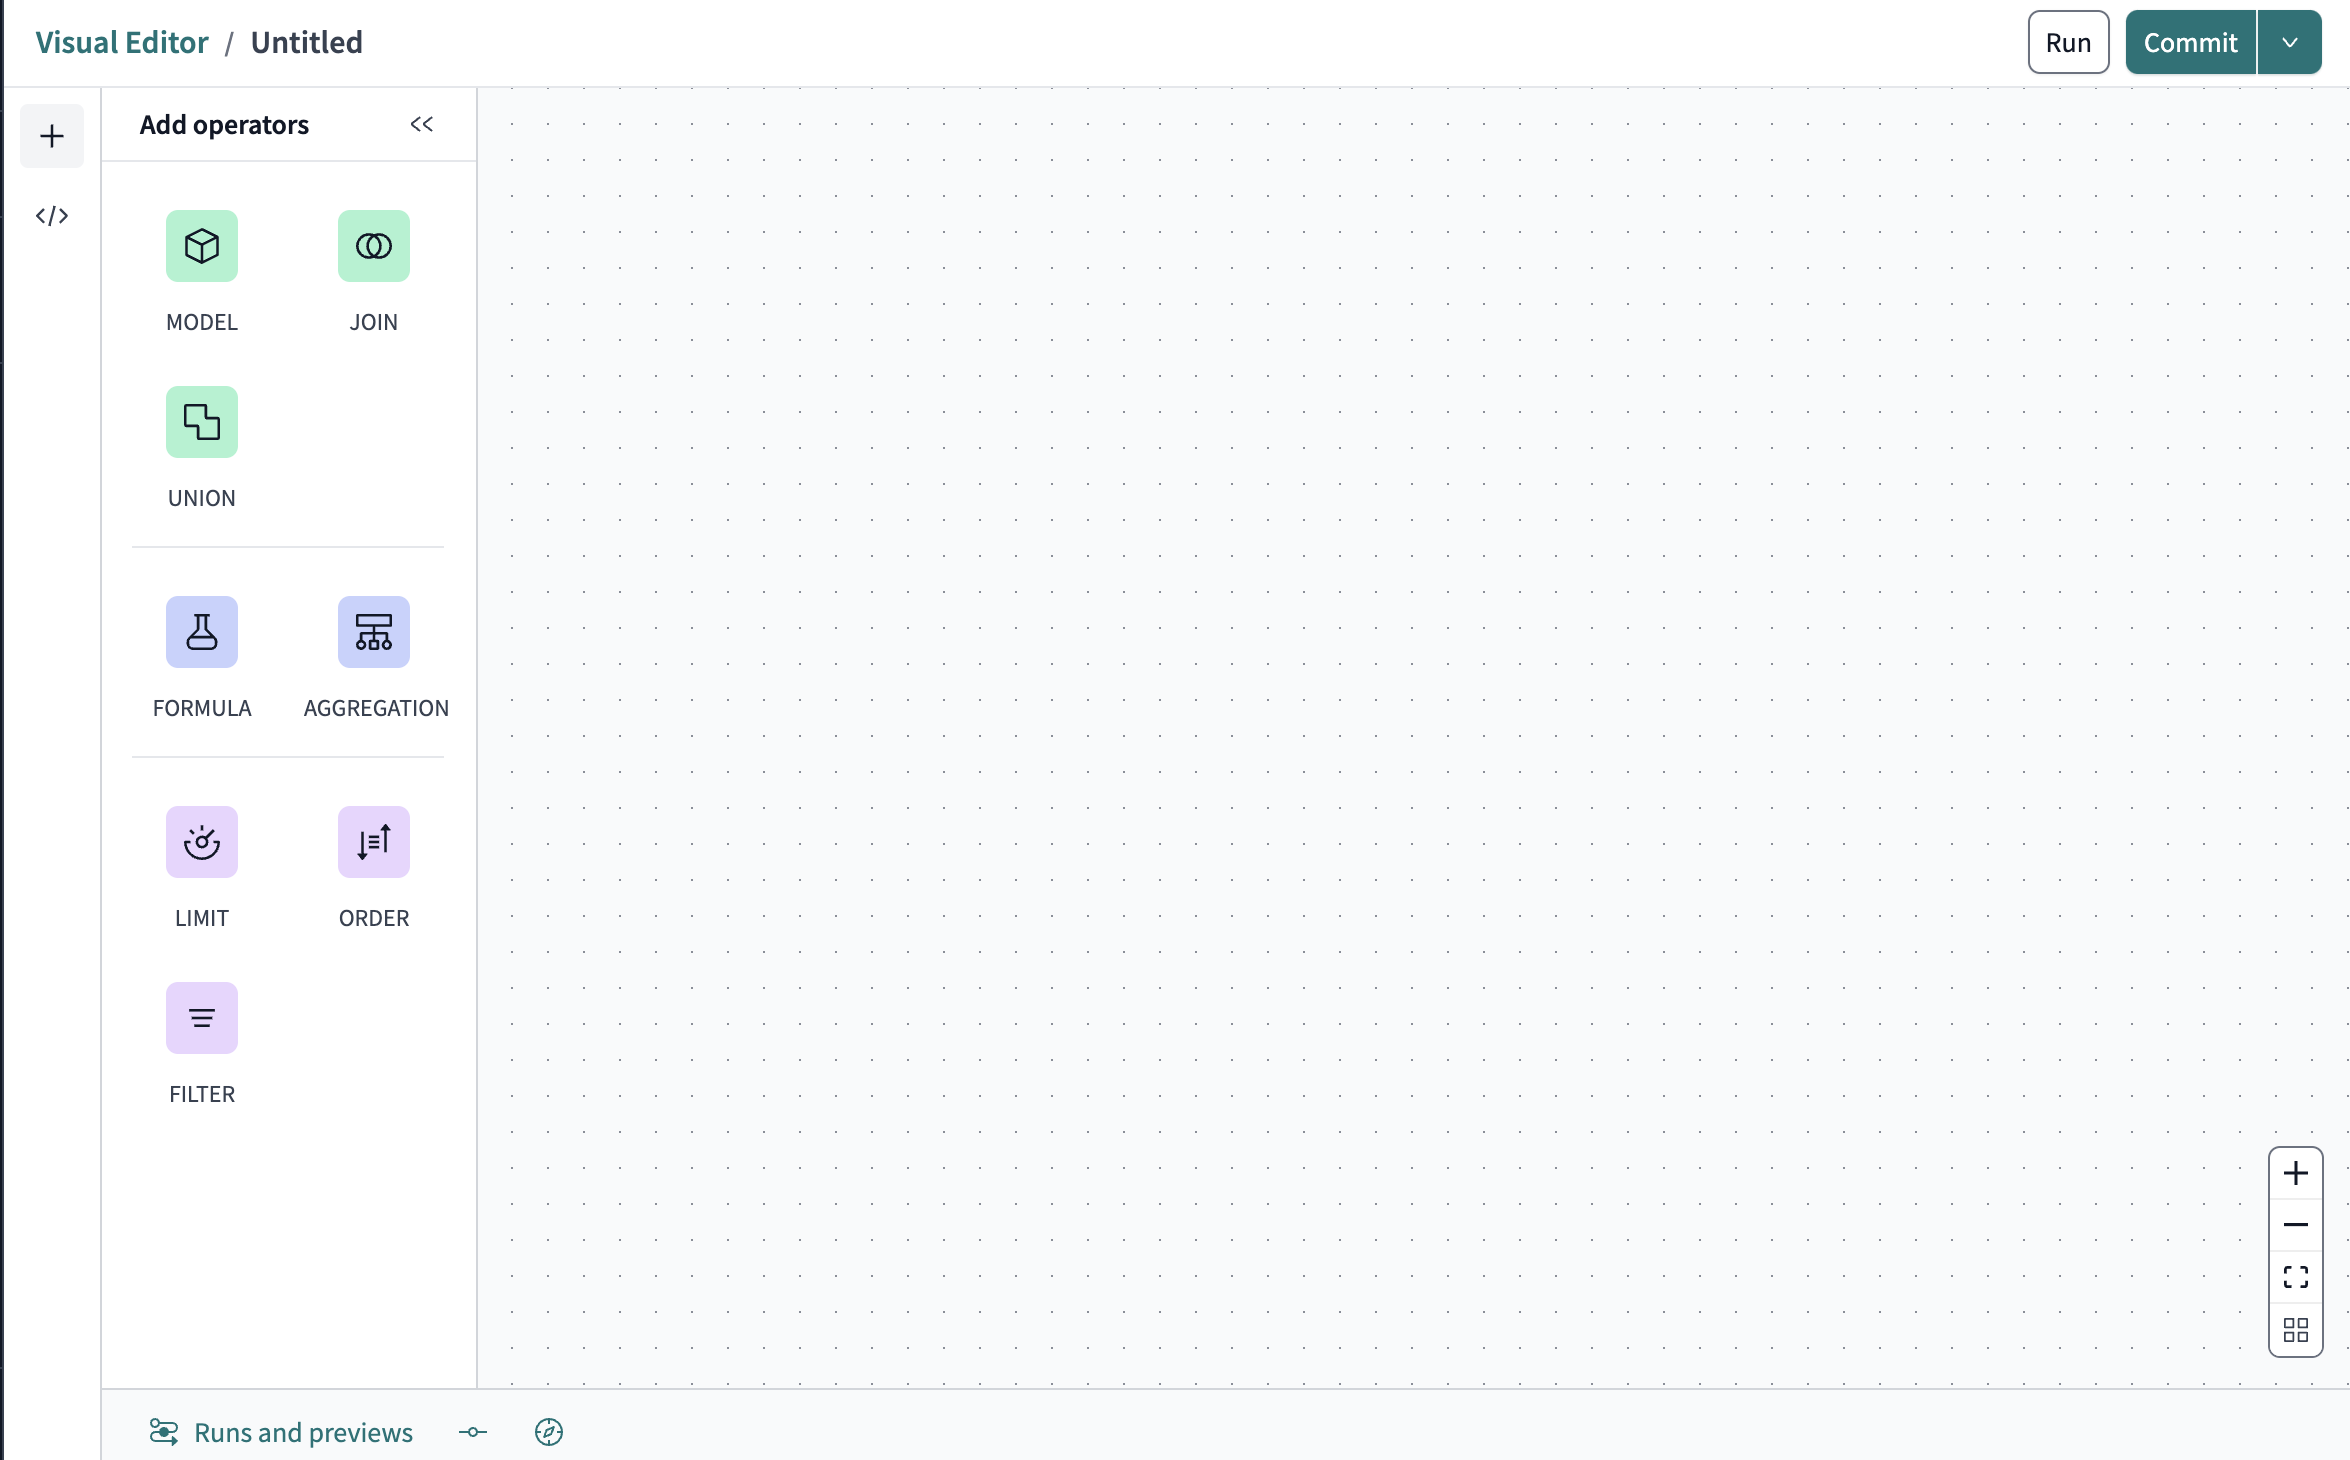
- The Operators menu contains the building blocks of creating a model with the editor.
- The SQL code area that displays the SQL that compiles your model.
- The Runs and previews that displays run data and previews data for individual operators.
- The Commit history display.
- The Explorer view of your model.
- The navigation tab that has icons for (from top to bottom):
- Zoom in
- Zoom out
- Center the model to fit the screen
- Auto-layout option for the individual operator tiles
- The Run command executes
dbt runfor the model. - This button is, initially, a Commit command for your integrated Git provider. Changes will be made to "Open pull request" once changes are committed. This will not appear until a change is made requiring a commit.
Create a model
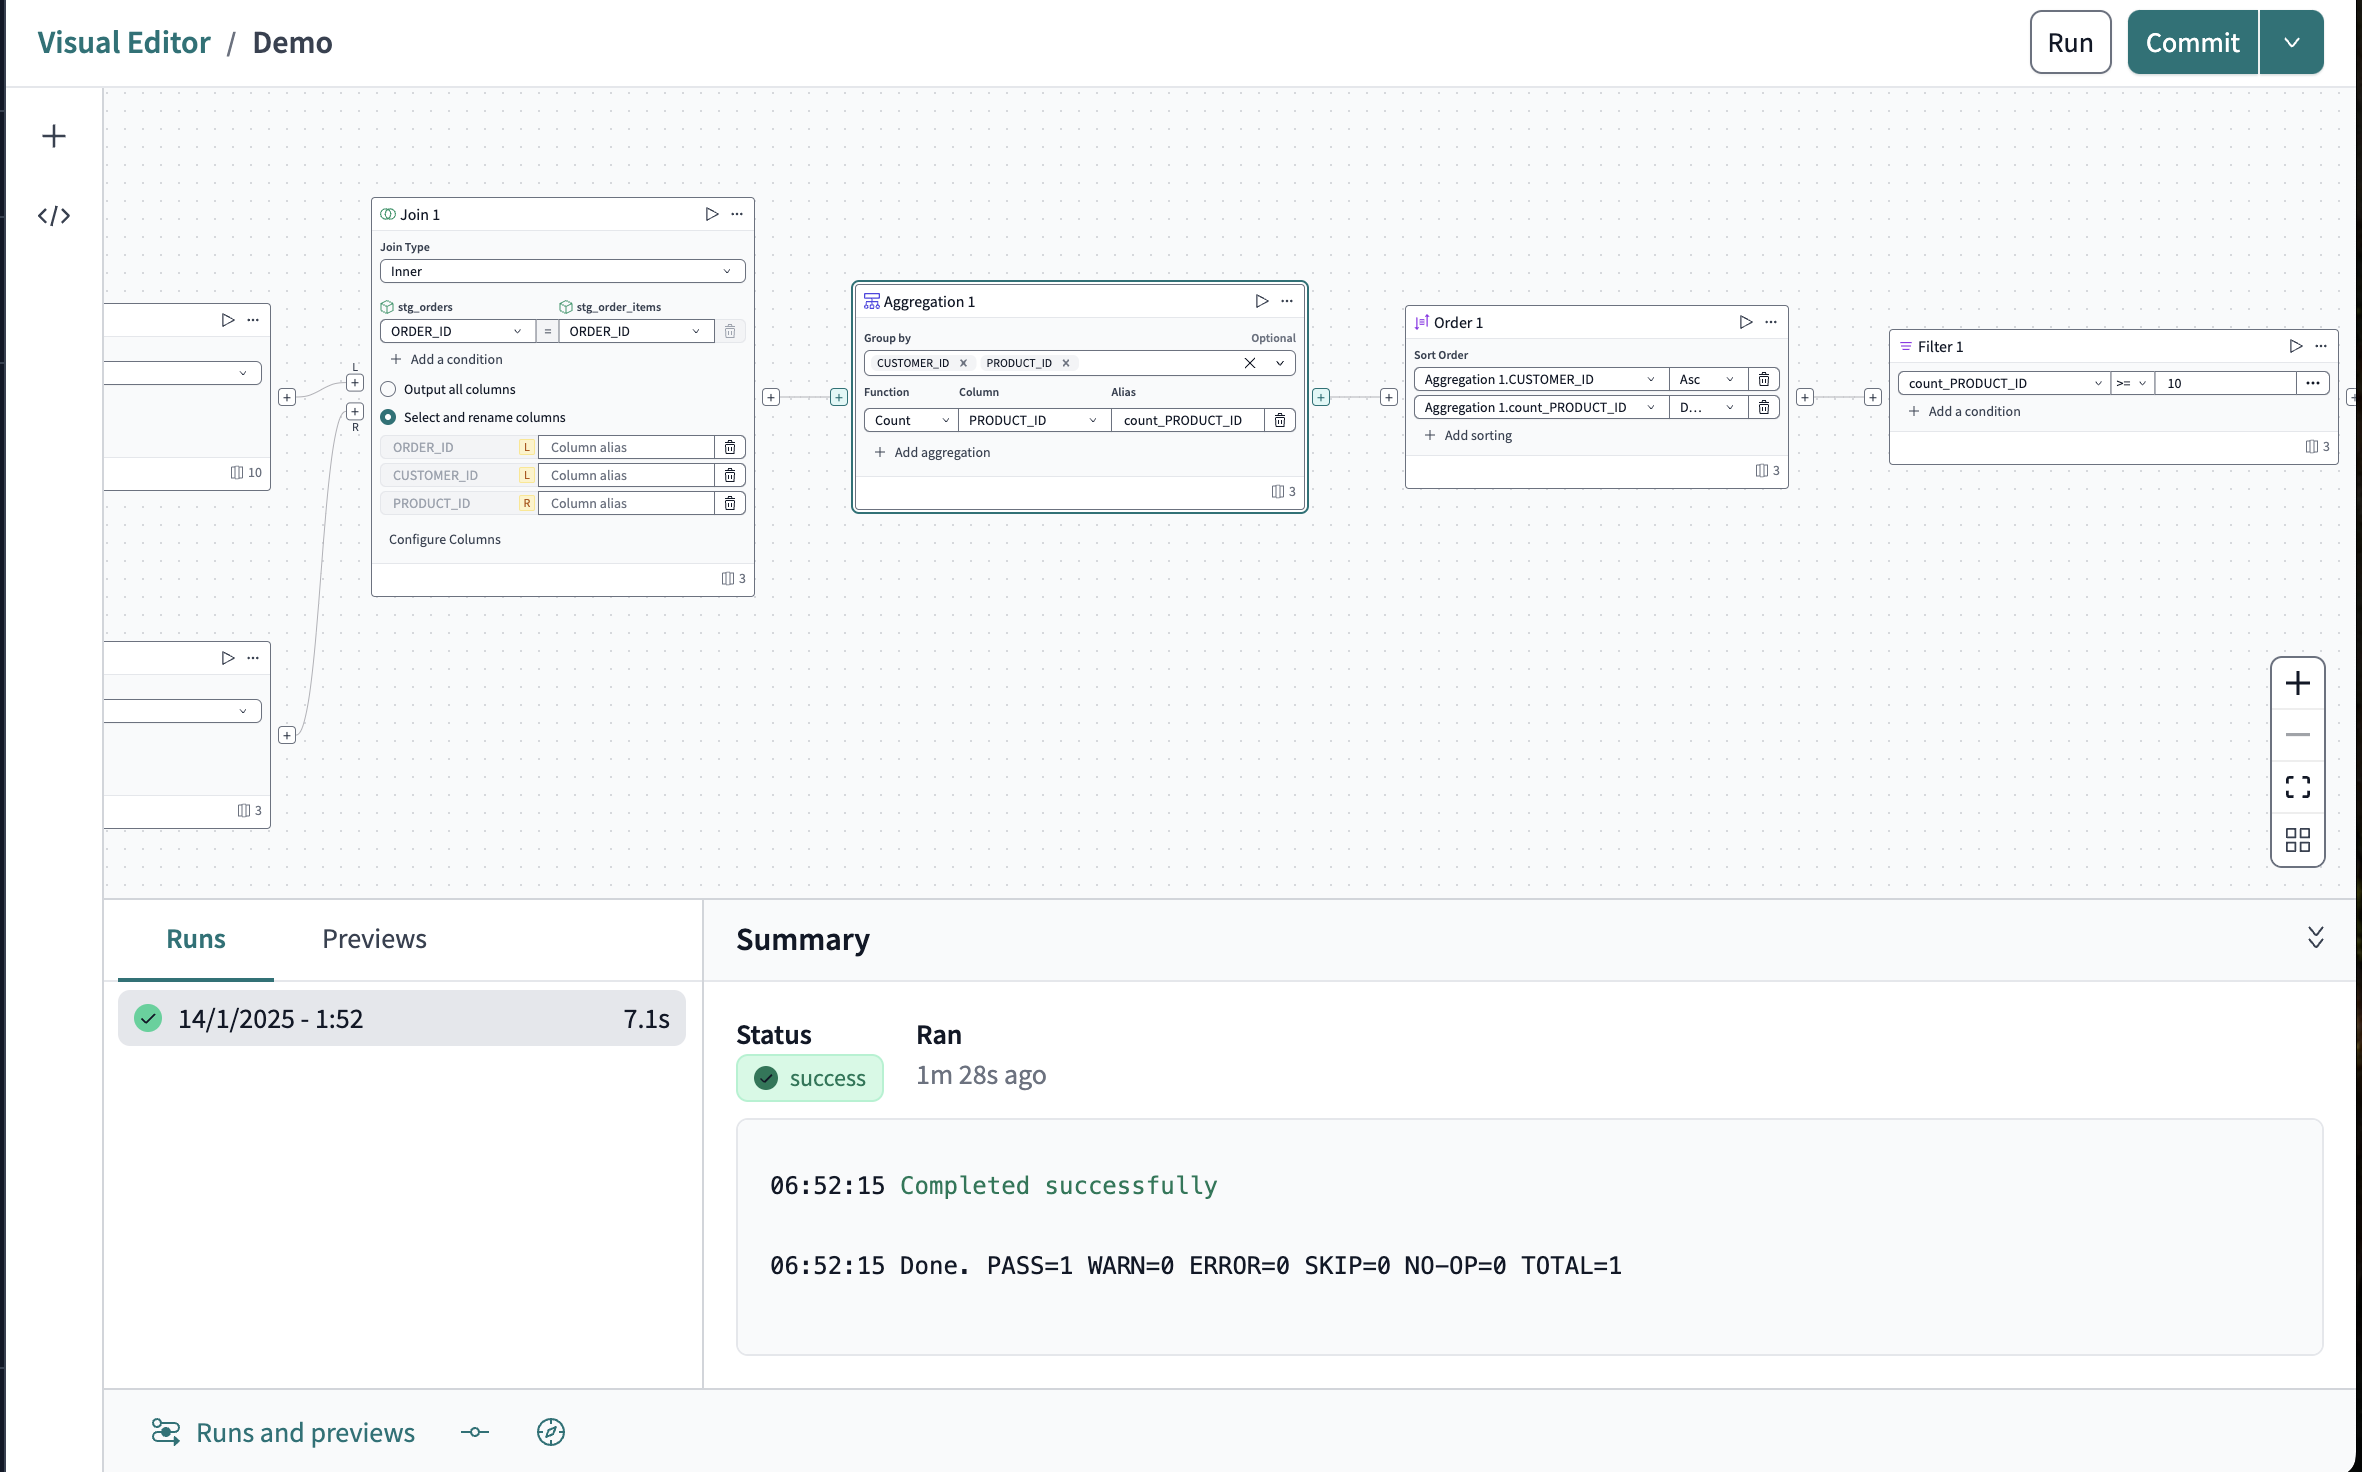
This section will walk you through creating a model with operators using sample data from the Jaffle Shop project. With this guide, you will create a basic model that transforms two datasets to build a view of repeat customer purchases while you consider a loyalty program for your shop.
The operators are the heart of your model. They determine what data will be transformed and how. Click the + icon to open the operator menu.
Read more about the individual operators to understand the basic purpose of each. Keep in mind that the model you're creating relies on existing models and that the term will primarily be used to reference the model operator in this section.
Operator tiles
The operators are drag-and-drop from their menu to the canvas, and when they are dropped they will create a tile.
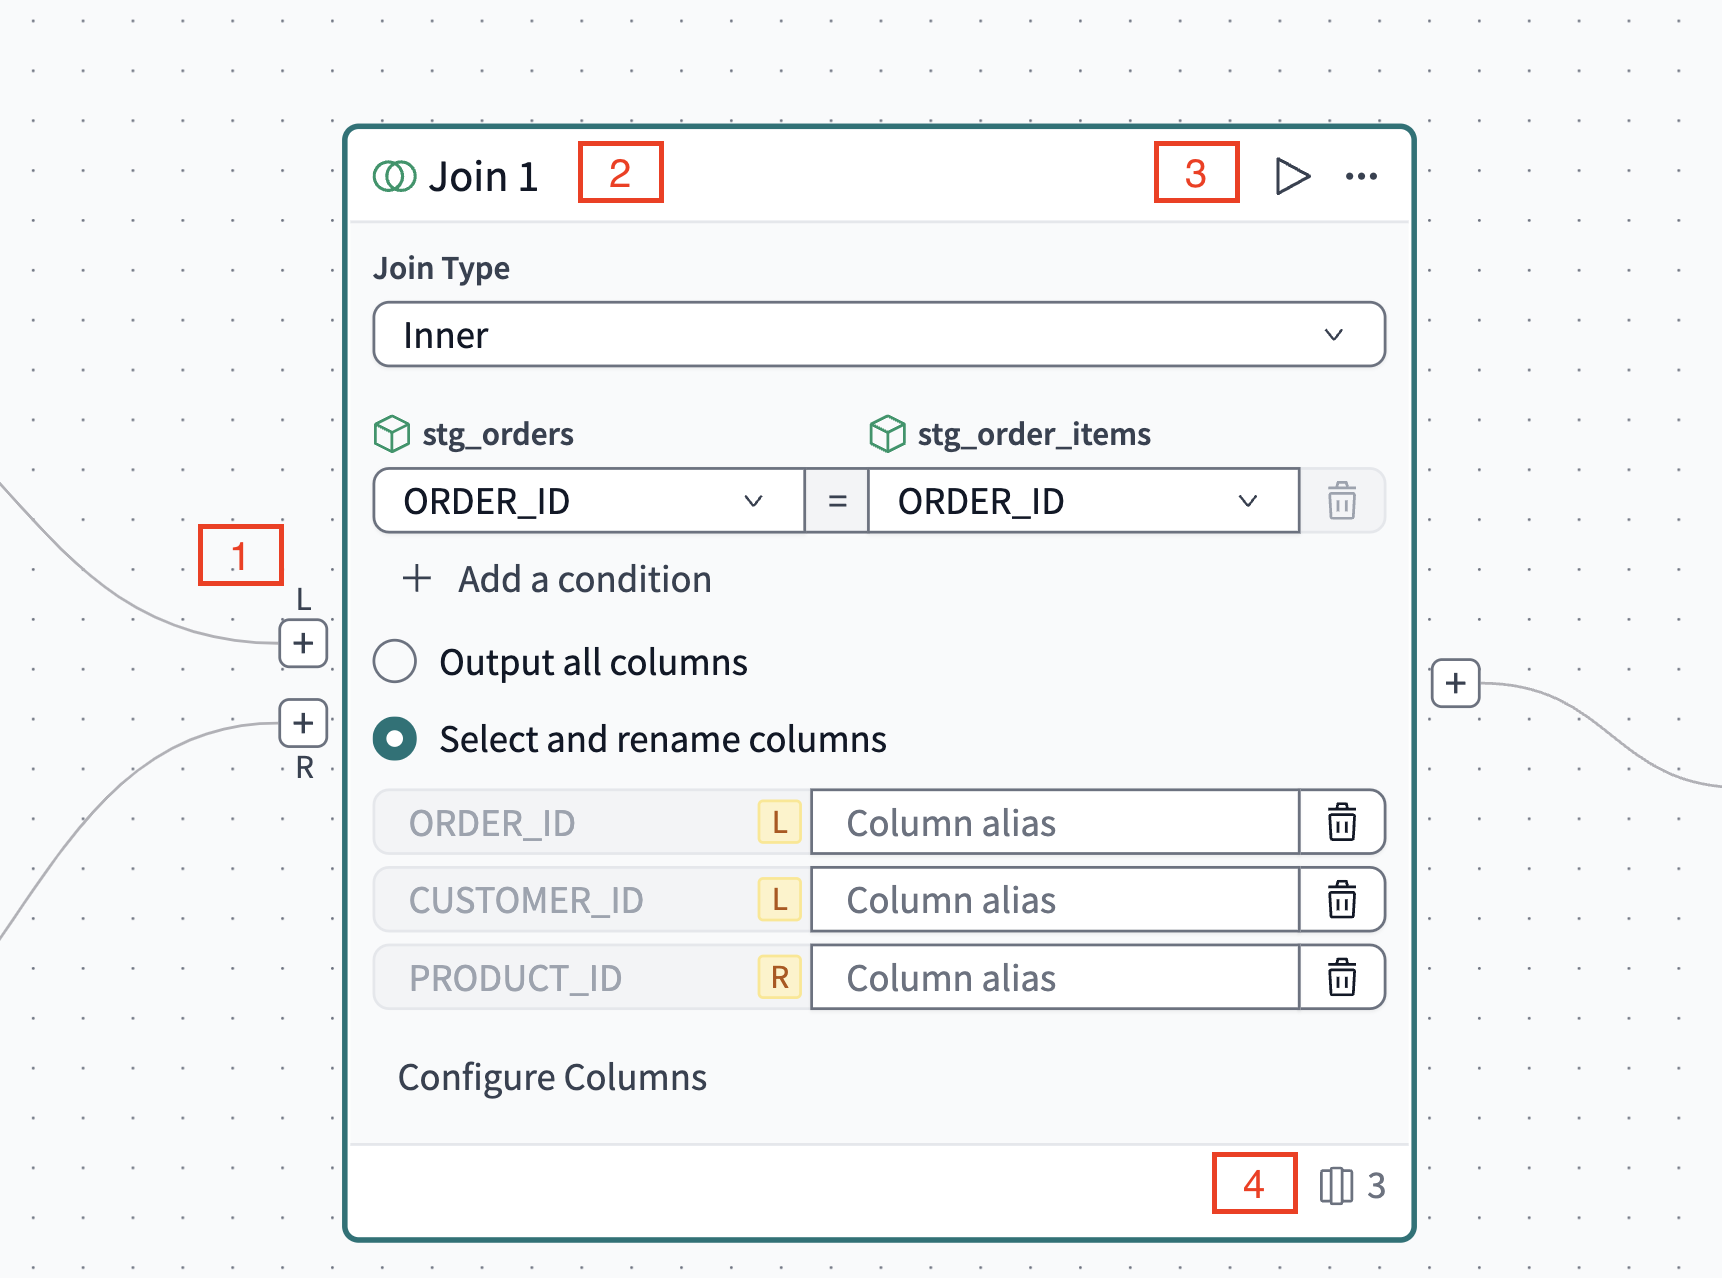
The tiles have the same basic setup with different fields depending on their function. All operators except for Model must be connected to another tile before configuring. Once configured, they’ll have the same basic layout.
- The connectors: Click-and-drag to the connector on another operator to link them.
- The title: Click to change. The examples in this guide will remain default.
- Play icon and menu: Preview the data at any point in its transformation by clicking the tiles play icon. The dropdown menu contains the option to Delete a tile.
- Column icon: The number next to it represents the number of columns in the data at that point in its transformation.
Make operator tile titles unique compared to your column names to avoid confusion, and the same applies to any aliases you create.
Create your source models
To get started:
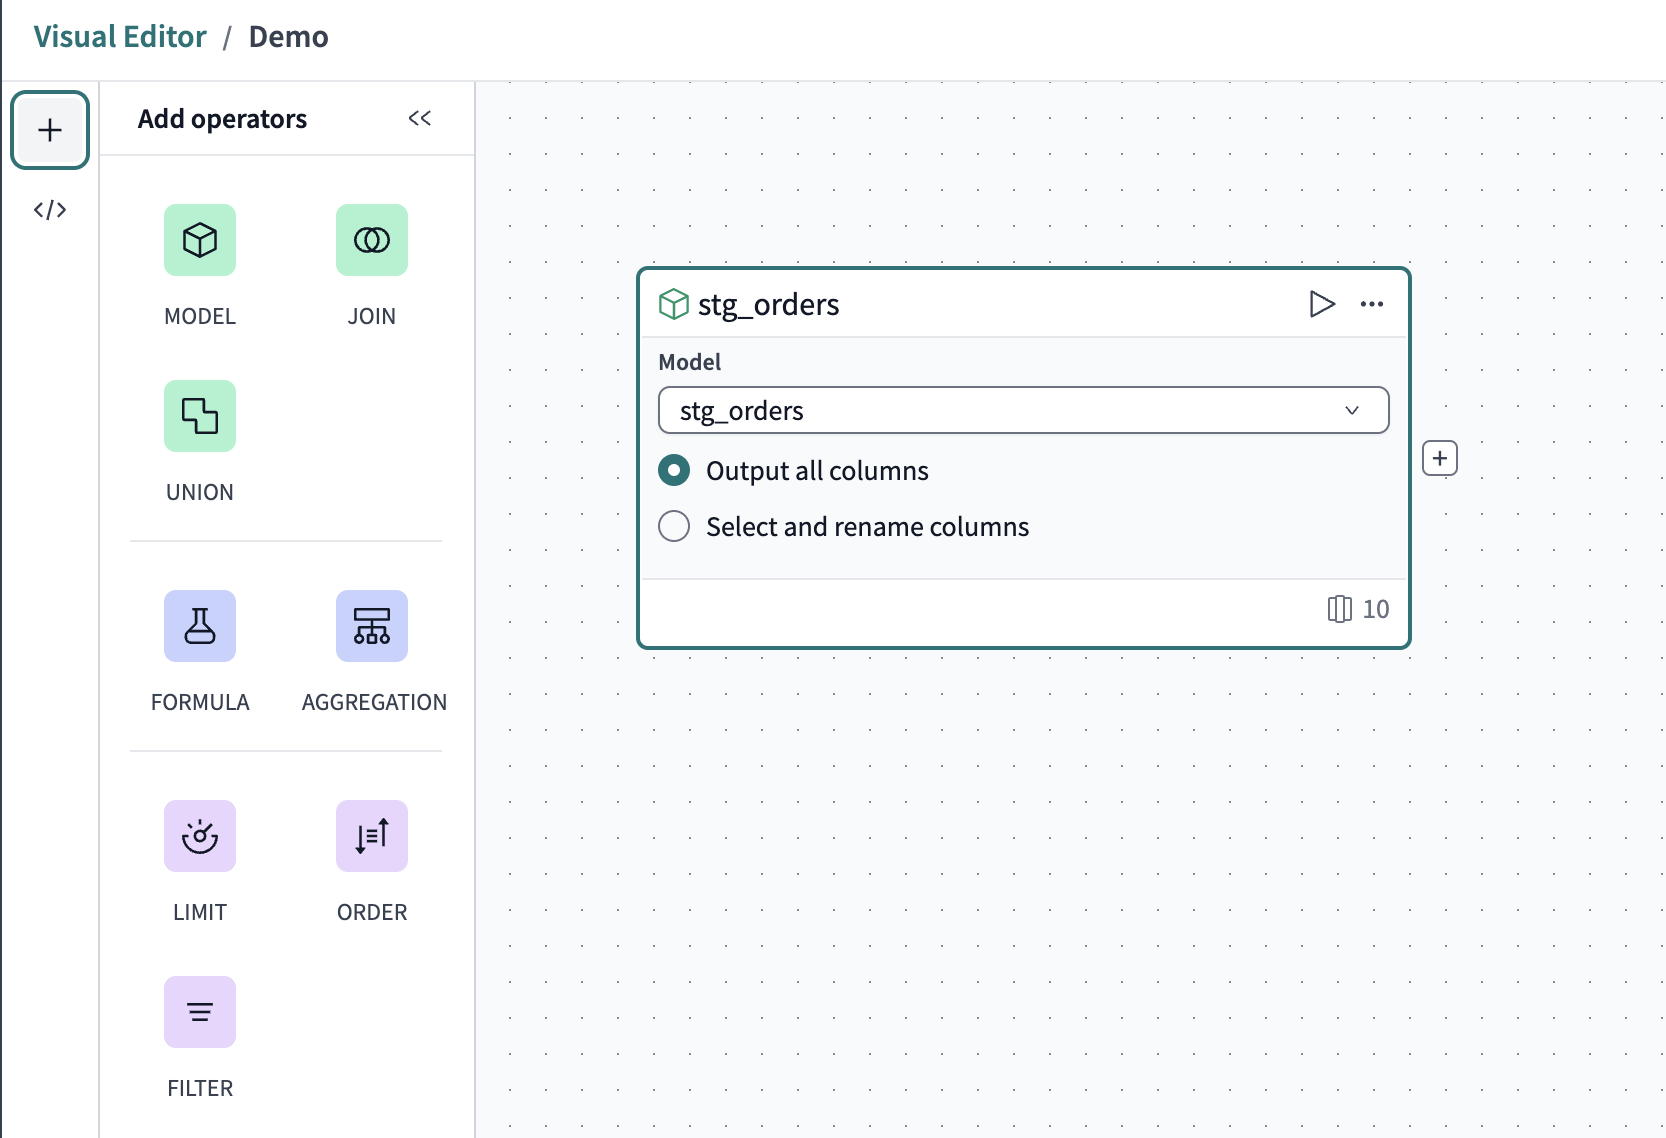
- Expand the Operators menu and drag the Model operator over to the canvas.
- Click Configure model and then select the source
stg_modelsfrom the dropdown. - Click the Output all columns option.
You now have your first data source!
-
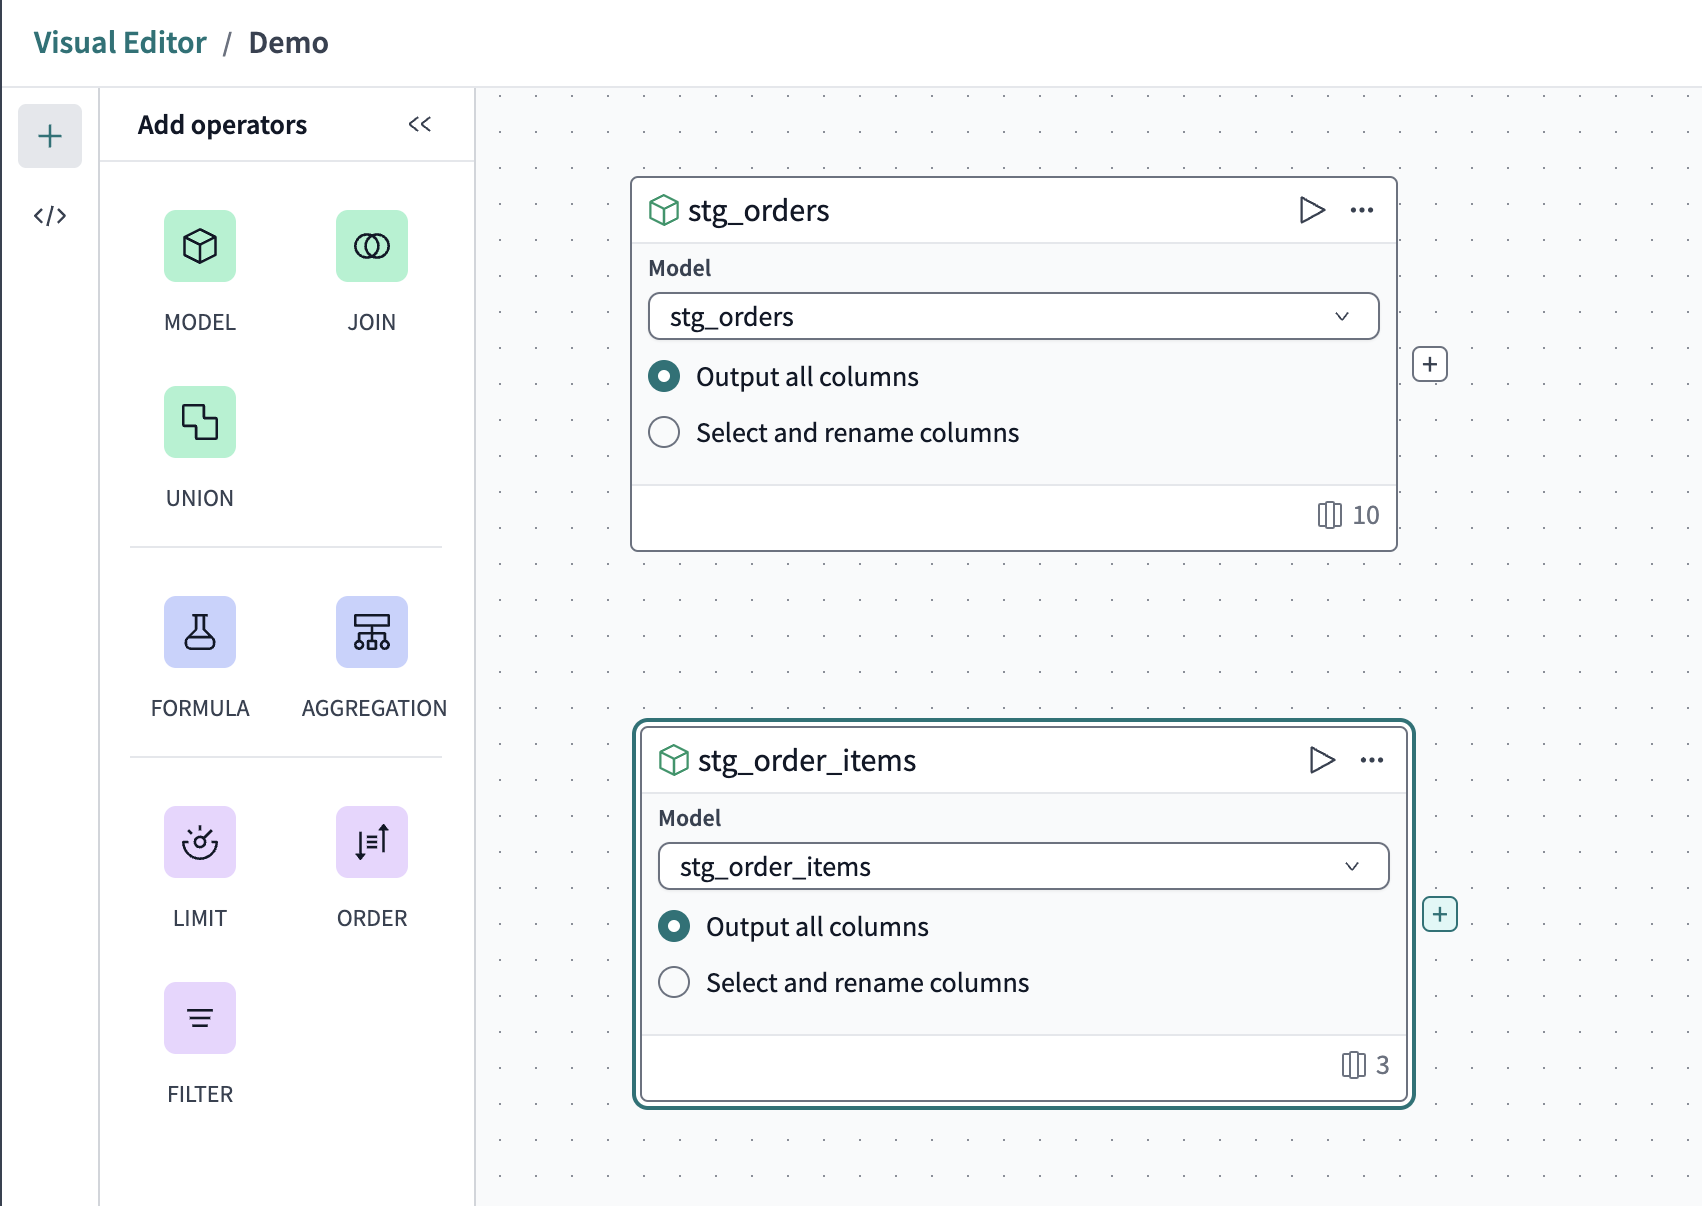
Drag a new Model operator to the canvas below the first and repeat the previous steps, but this time set the source model to
stg_order_items.
Now, you have two source data models and are ready to transform the data!
Don't see a source model you're looking for? Ask your dbt admins to ensure it's been run recently and hasn't gone stale.
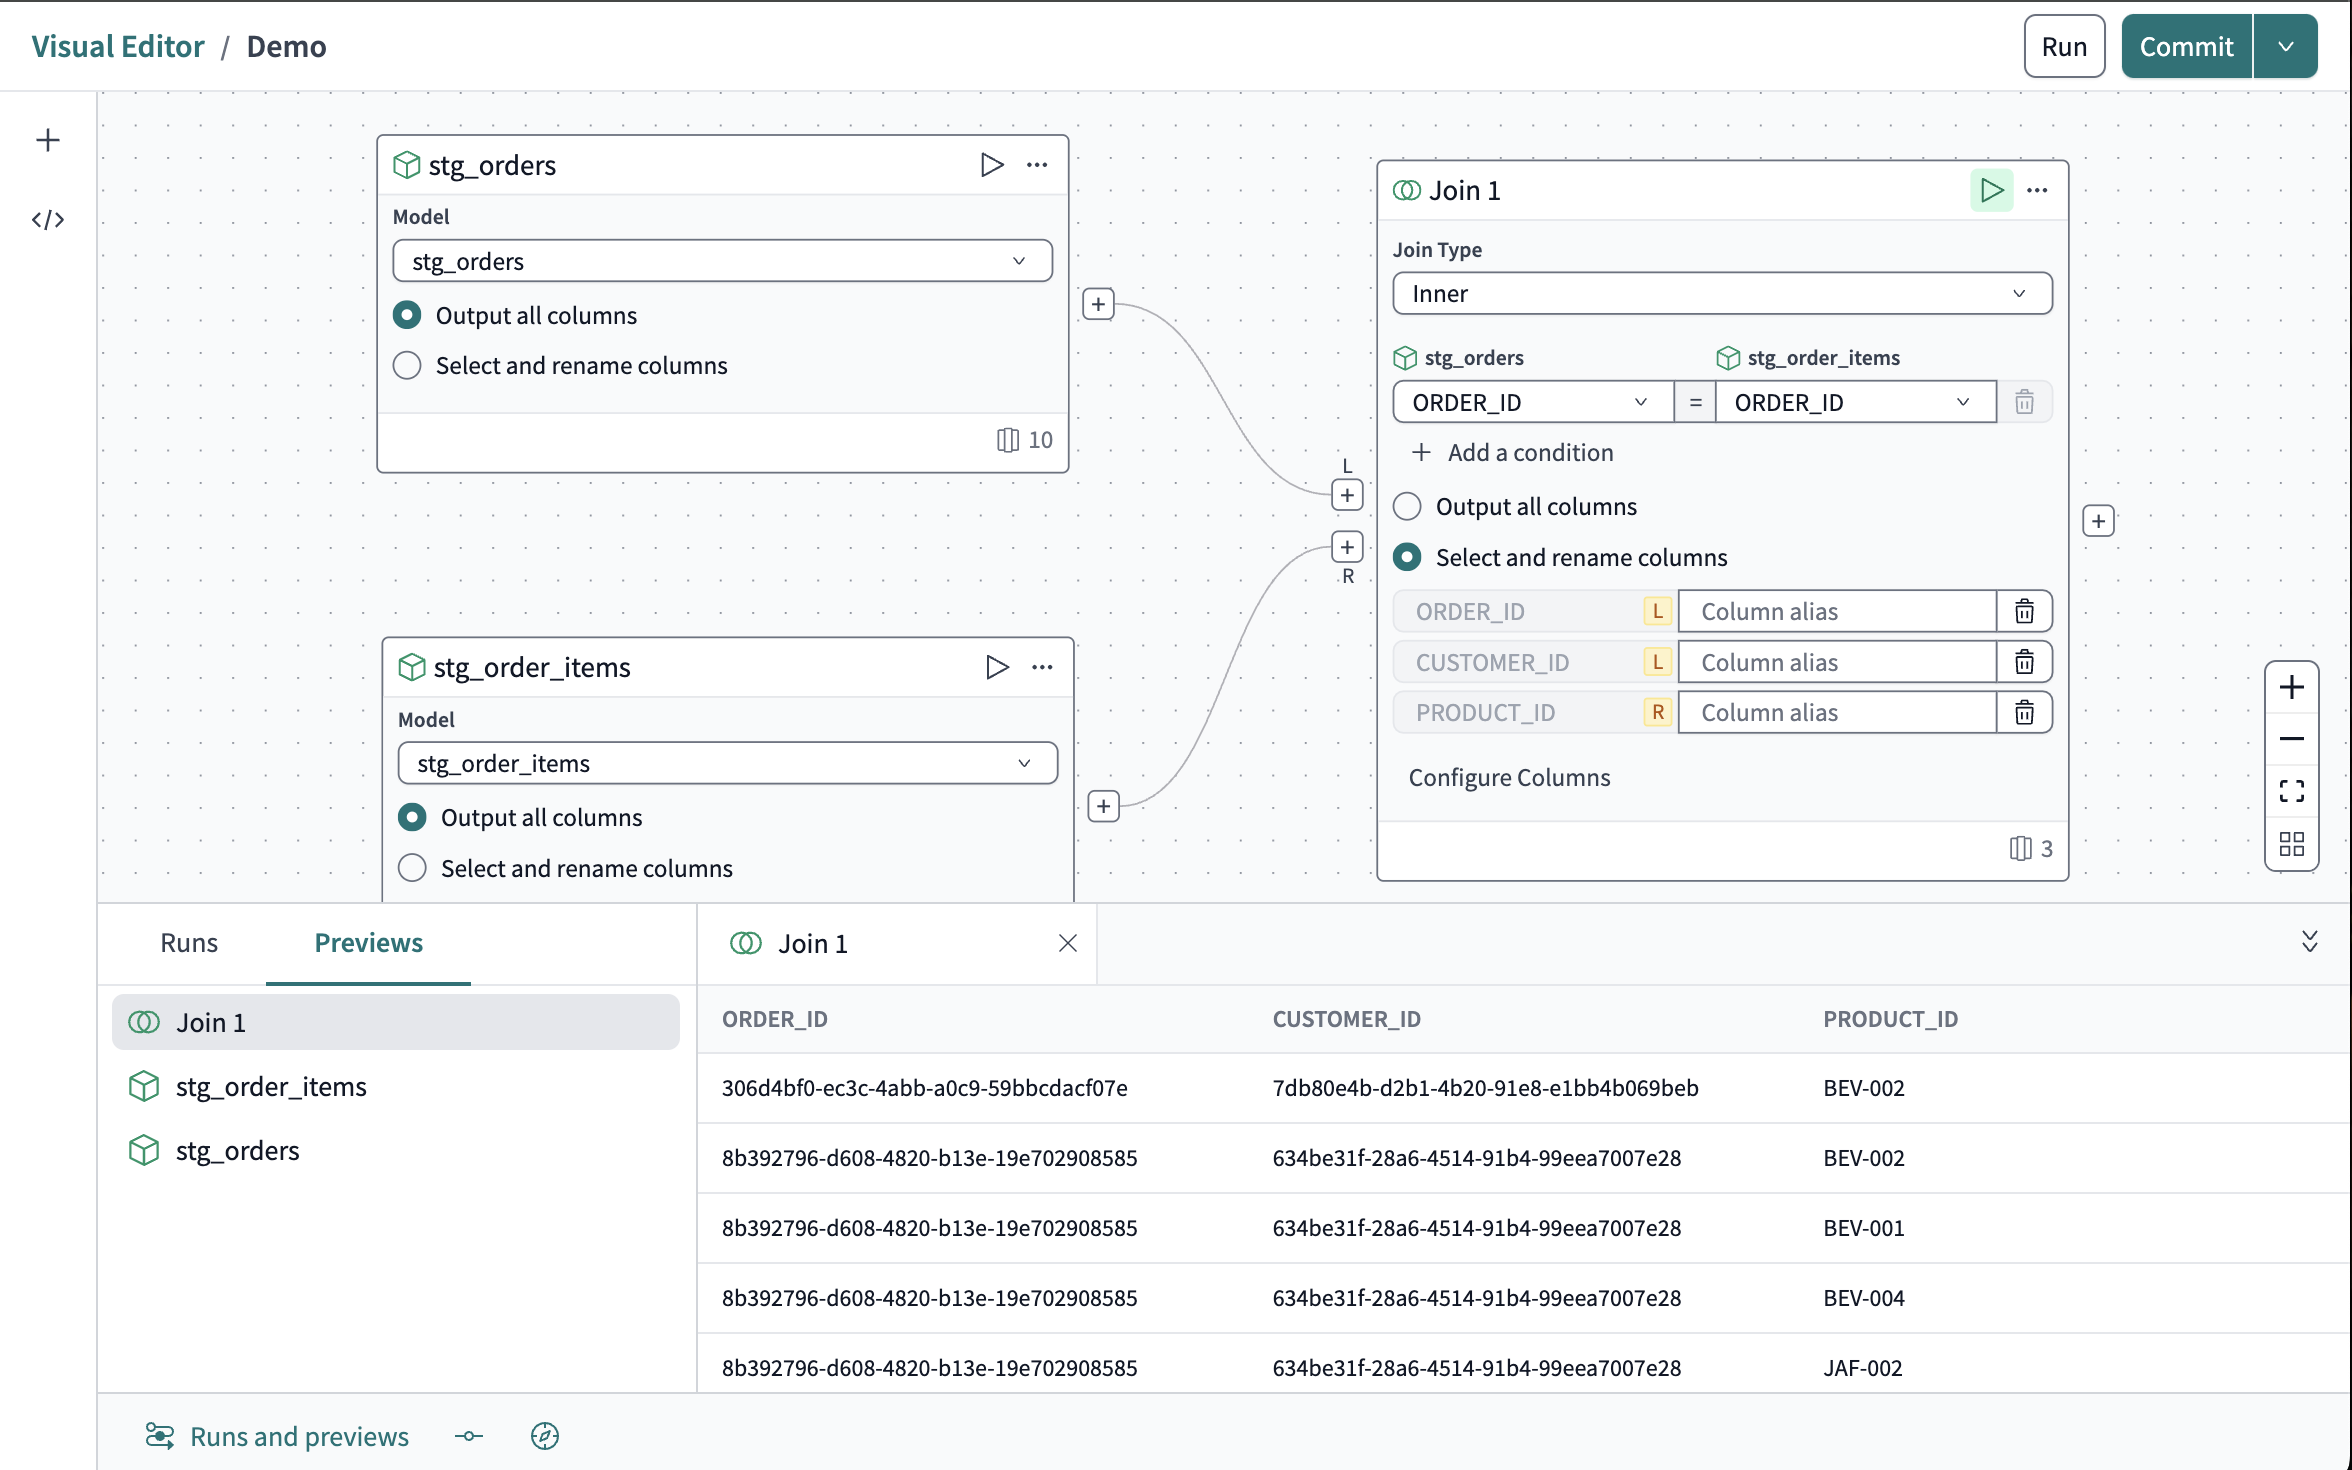
Create a join
-
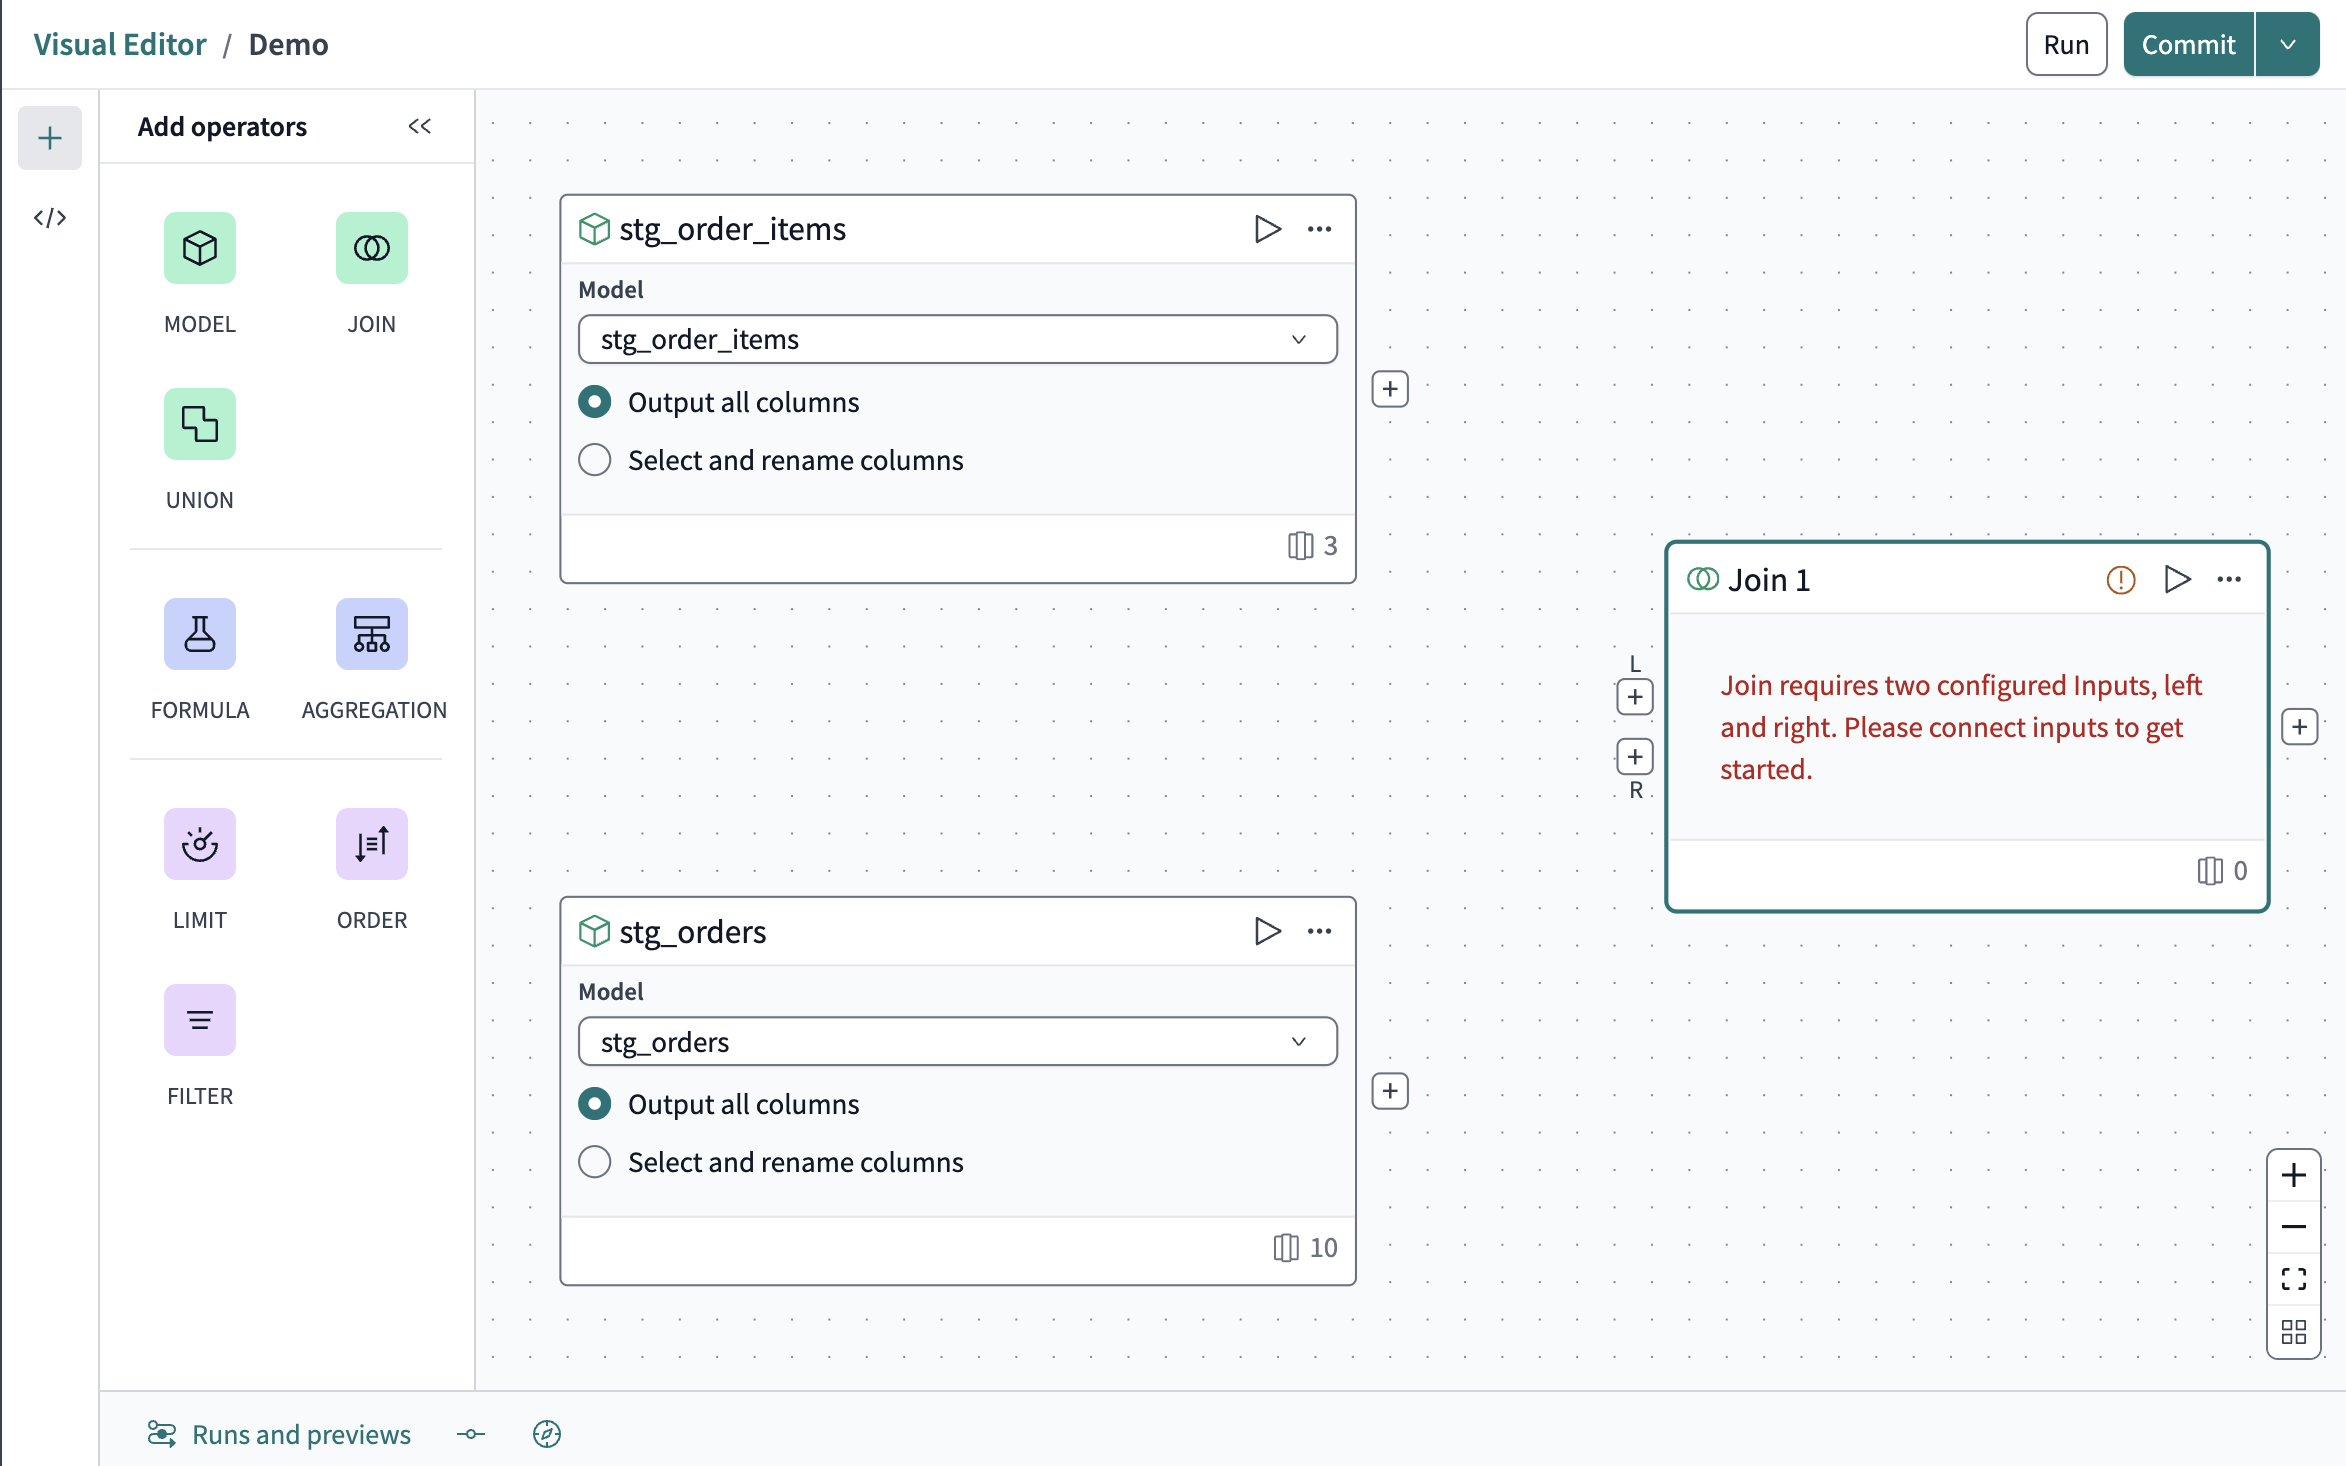
From the Operators menu, drag the Join operator onto the canvas to the right of the source models.
-
Click and drag a line from the + connector below the
Lon the join border to the + on thestg_ordersmodel. Do the same for theRconnector to thestg_order_itemsmodel. -
In the Join tile, click Configure join condition.
-
Set the Join type to
Inner. -
In the pair of dropdowns, set both
stg_ordersandstg_order_itemstoORDER_ID. -
Click Select and rename columns and click Configure columns select the following columns:
- From
stg_ordersclickORDER_IDandCUSTOMER_ID. - From
stg_orderclickPRODUCT_ID. - Note: These will appear in the order they are clicked.
- From
-
You've now built your join! Test it by clicking the Play icon in the top right corner of the join tile. Your data will populate in the Runs and previews pane.
Your work in the Visual Editor is automatically saved as you progress, so if you need a break, you can always come back to a session later. Just be sure to give it a unique title!
Enhance your model
You've got the basics going with your Visual Editor model! It has successfully joined two source models, but you need to further transform the data to get what you need. A list of customers who buy repeat items as you consider a loyalty club rewards program.
Aggregate data
Multiple options for transforming your data include custom formulas, filters, and unions. Keep it simple and add an aggregation operator to tell you which customers buy the most repeat products.
-
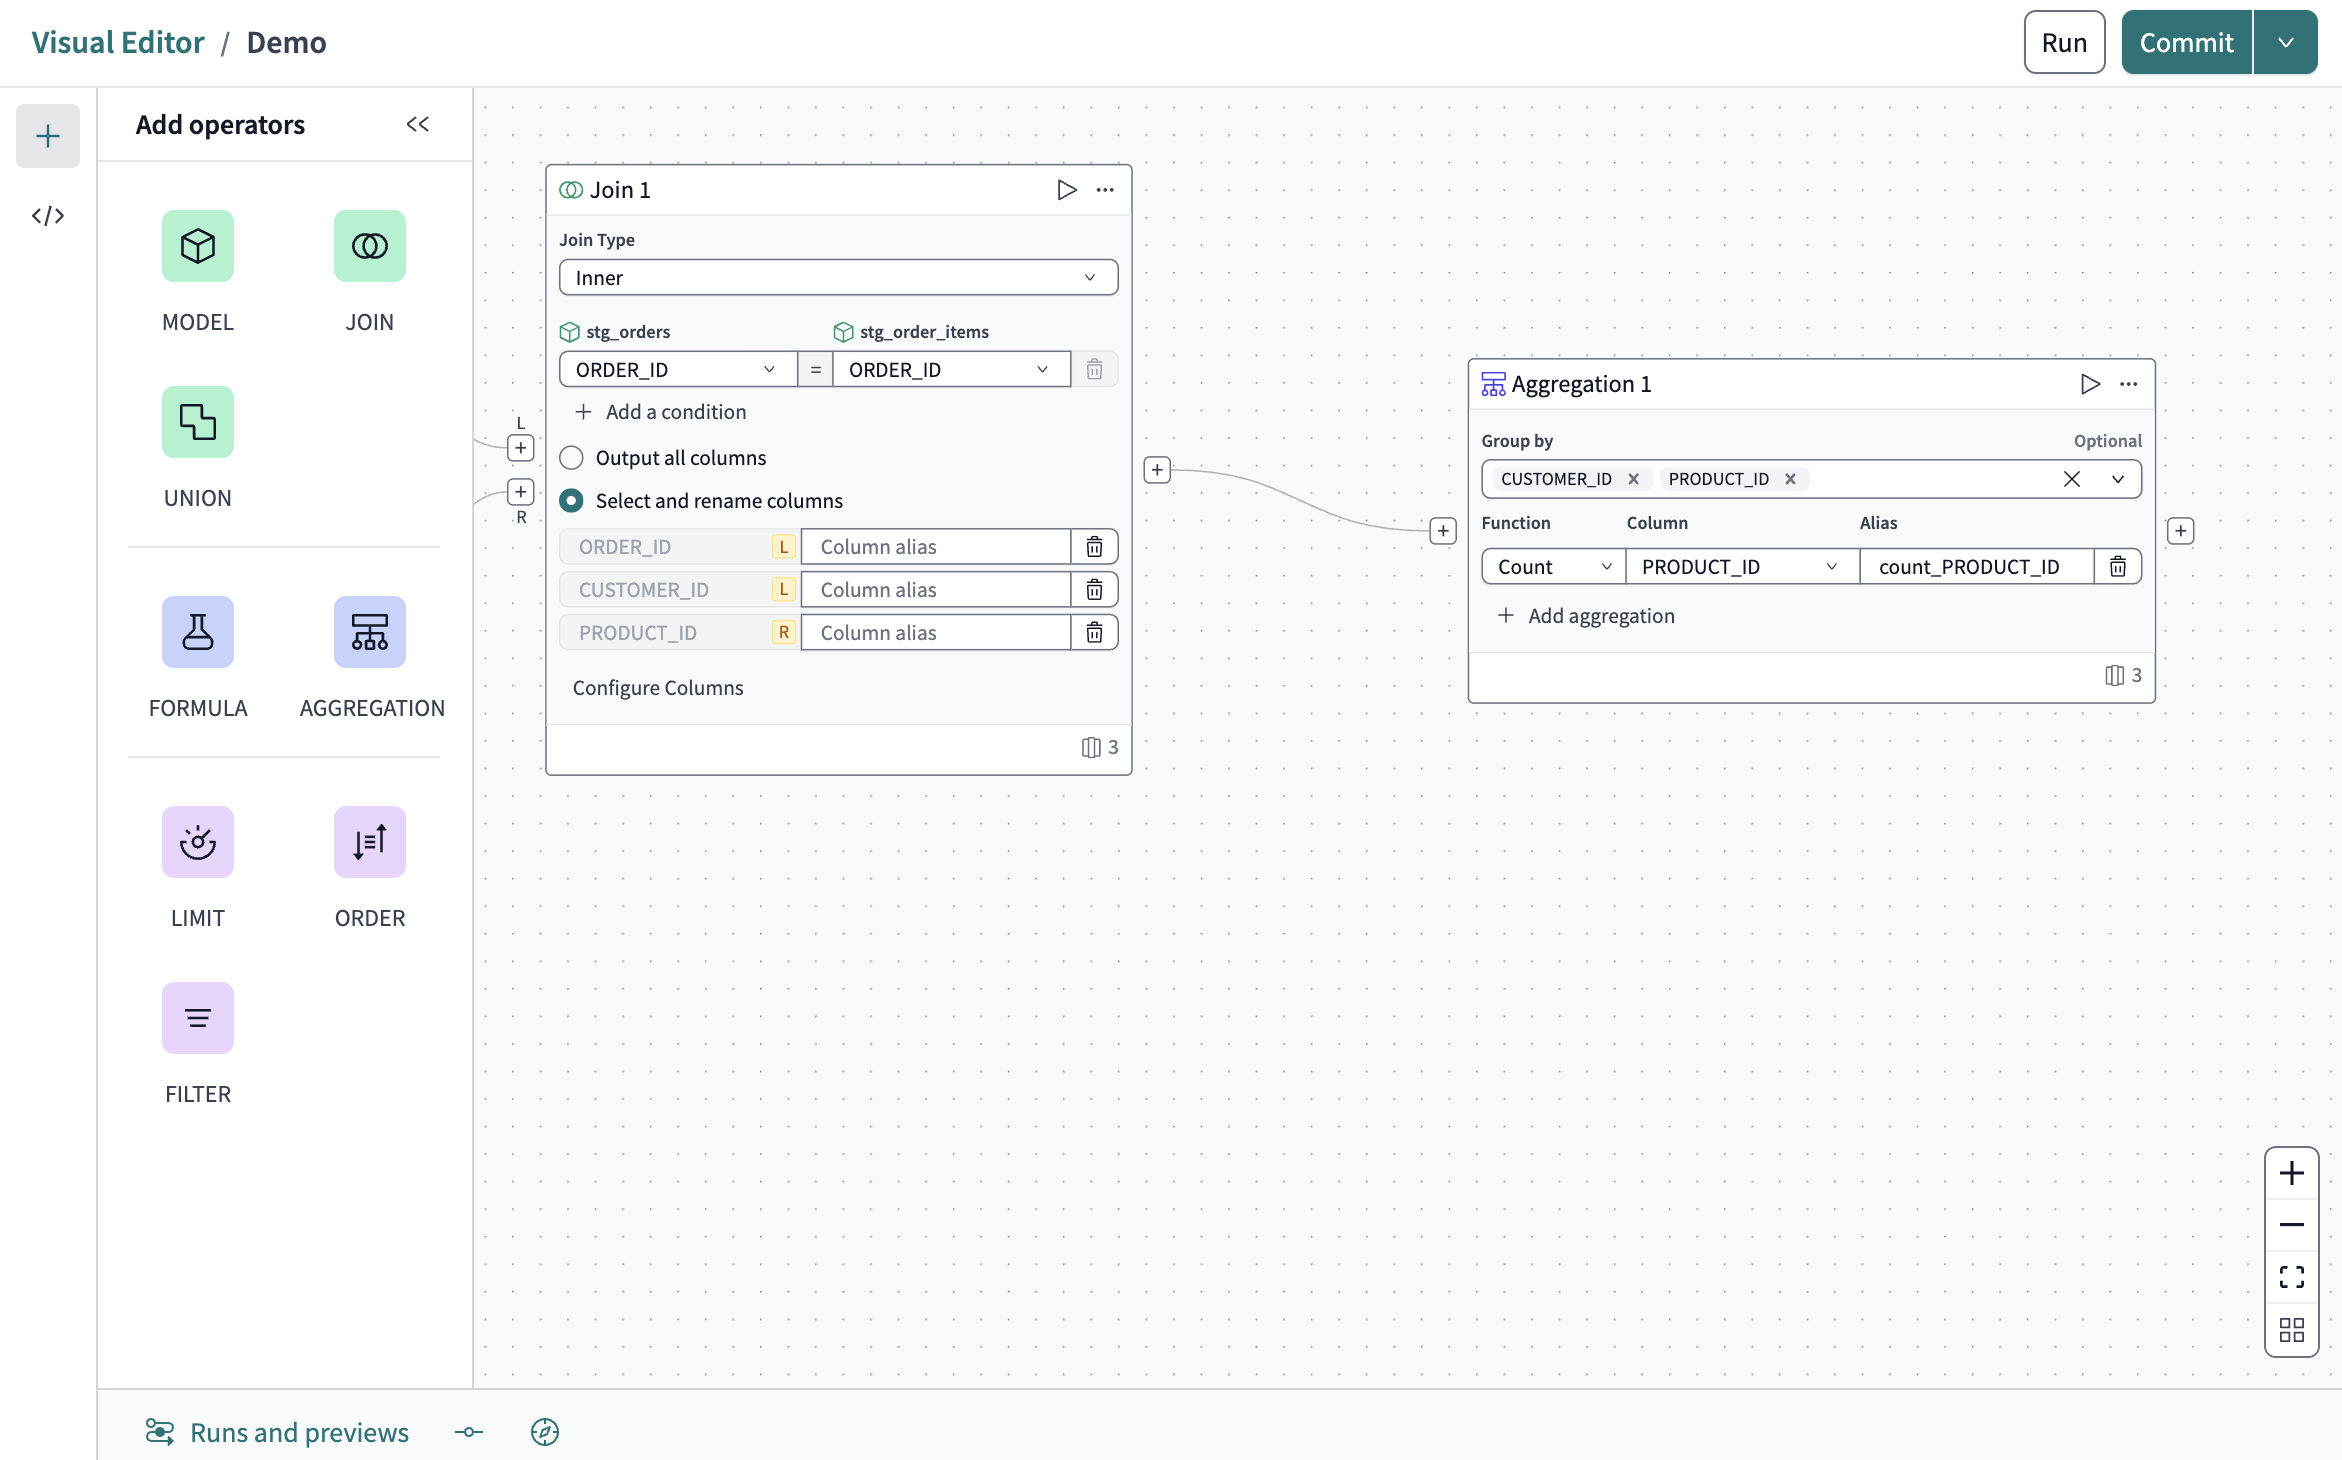
Drag the Aggregation operator over to the right of the join.
-
Connect the aggregation operator to the join operator.
-
Click Configure aggregation in the Aggregation tile.
-
Click in the Group by field and first select
CUSTOMER_IDthenPRODUCT_ID. -
Configure the next three fields with the following:
- Function: Count
- Column: PRODUCT_ID
- Alias: count_PRODUCT_ID
-
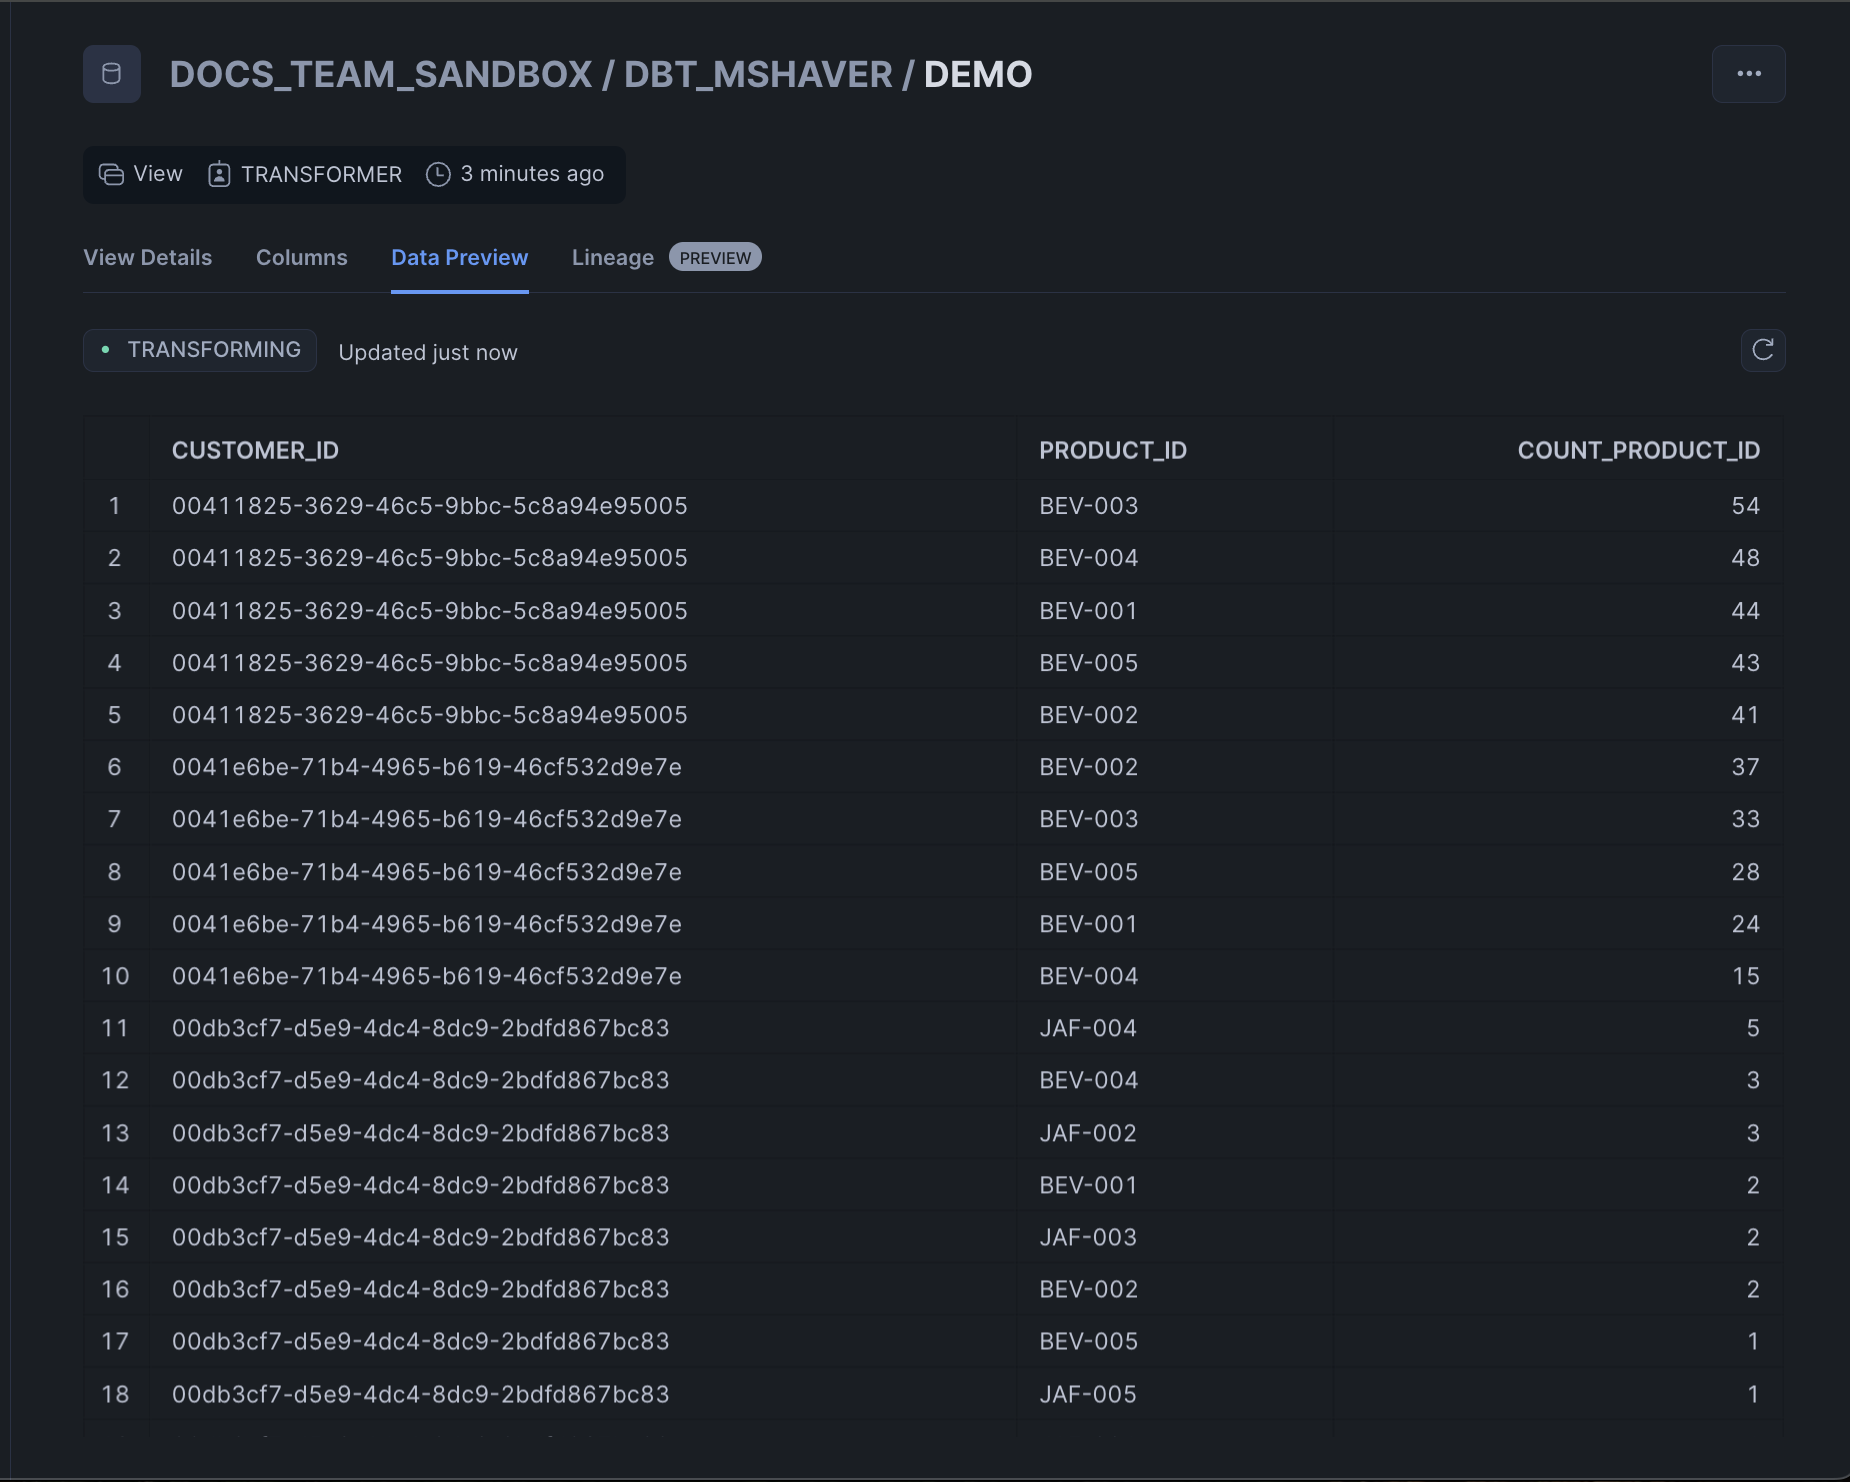
Click the Play icon to preview the data. You're starting to see the results you're looking for, but the data is scattered. Let's clean it up a bit more.
As your model grows, you can zoom in and out to view your needs. Click and hold in empty canvas space to drag your setup across the screen. Click the Fit view icon to see your entire model on the screen. Click the Auto layout icon to auto-arrange the tiles efficiently.
Add some order
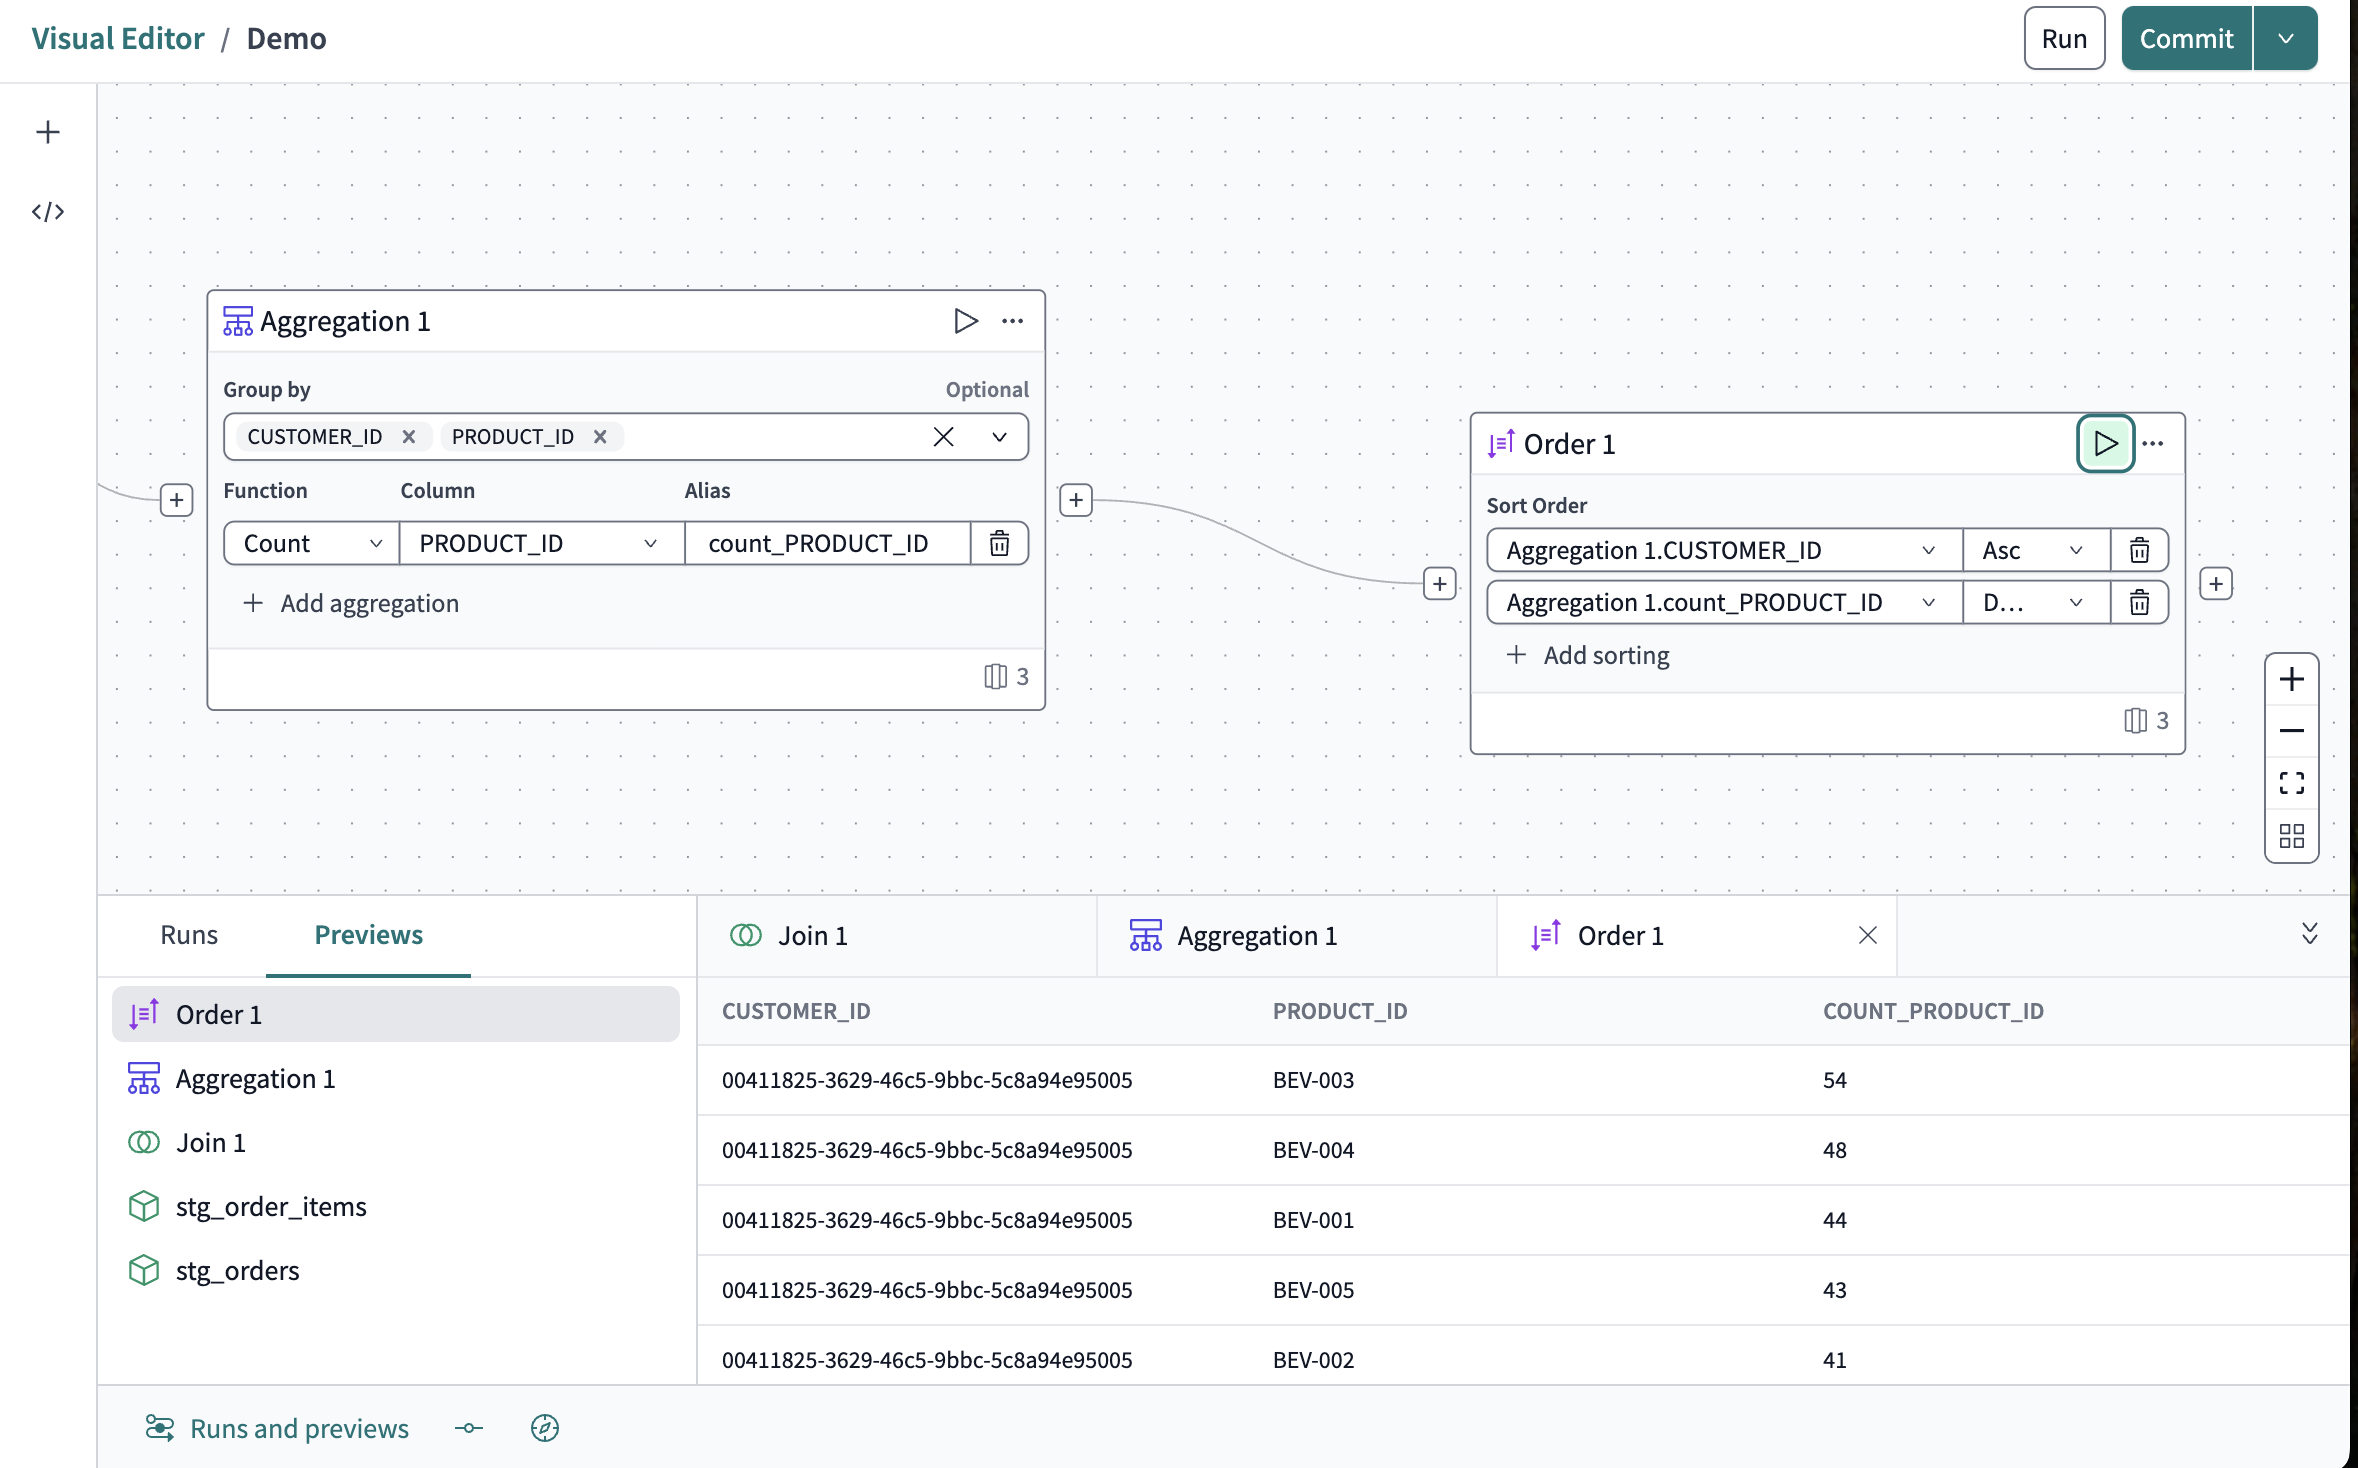
There's a lot of data there. Dozens of customers are buying hundreds of products. You will sort it so that the customers are listed ascending by their CUSTOMER_ID number, with the most purchased products listed in descending order.
-
Drag the Order operator over to the right of the Aggregation tile and connec them.
-
Click Configure order.
-
In the Sort order field click Select column and click
Aggregation1.CUSTOMER_IDfrom the dropdown. Set it toAsc. -
Click Add sorting and in the new Select column field select
Aggregation1.count_PRODUCT_ID. Set it toDesc. -
Press the Play icon to preview the new data.
Want to practice on your own? Try adding a Filter operator that removes items with less than 10 sales for any customer ID. Be sure to run the preview and verify the data is correct.
Run and share your model
Now that you've built a model that results in the data you want, it's time to run it and push it to your Git repo.
Run
To run your model, you only need to click the big Run button. With the Visual Editor, there is no command line and no need to memorize a list of commands; there is only Run. Click it to see the results populate in the Runs and previews pane.
This will materialize the data as a view in your developer schema in the database. Once the model has been merged with your project and dbt run is executed in your Staging or Production environments, it will be materialized as a view in their related schemas.
Git commit
The models built in the Visual Editor are a part of your larger dbt project. They are stored in the visual_editor folder of your /models directory. This is all done automatically; you don't have to configure any paths or directories.
However, it won't be created in your Git repo until you commit your first model. So, back in the model's view:
- Click Commit in the top right.
- If you've already created a commit and wish to make more, click the arrow next to Create a pull request to see the Commit option.
- Fill out the Description field with information about your model. If it's long, part of it will be included in the pull request title, and the rest will be in the body. That's okay! You can correct it during the PR creation process.
- Click Commmit.
- The Commit button will change to Create a pull request. You can add more commits, but click the Create a pull request button for now. You will then be redirected to your Git provider in a new tab.
The following examples use GitHub as the provider:
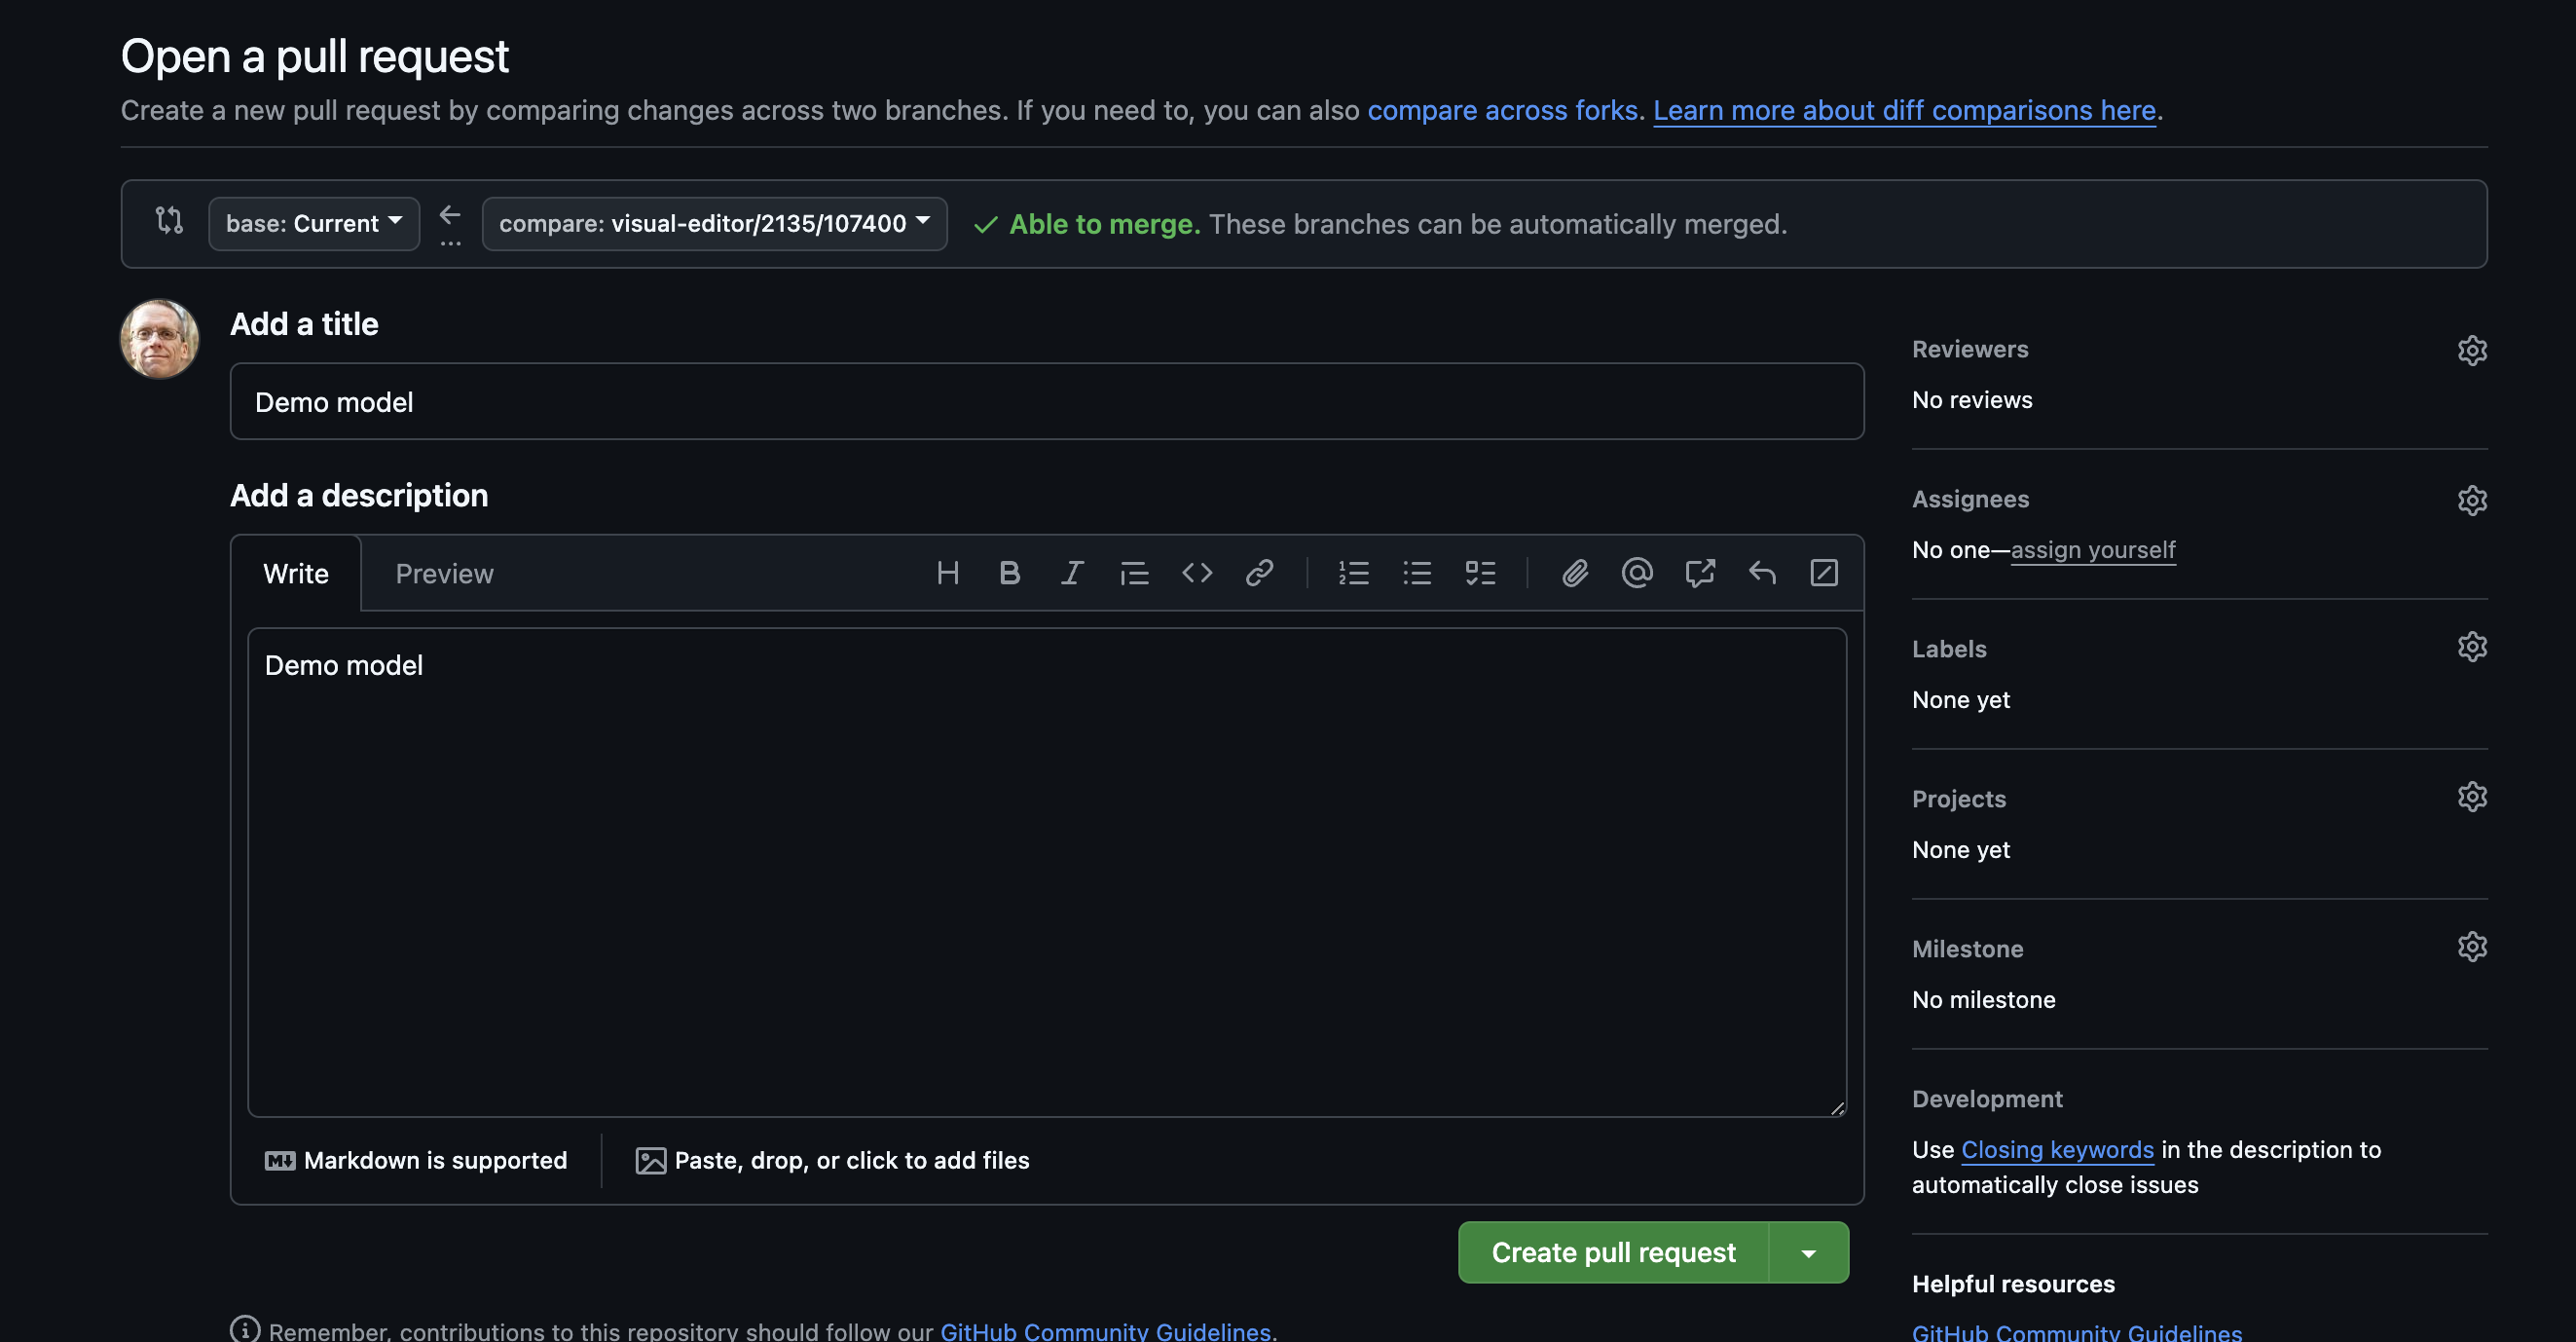 Example of the screen you're taken to in GitHub when you create a pull request from the Visual Editor.
- Click Create pull request in the GitHub window.
- Complete the Add a title and Add a description fields. If your description is split between both, copy all the contents to the description field and give it a shorter title.
- Click Create pull request.
You've just submitted your first model from the Visual Editor for review. Once approved and merged, the model will be included in your organization’s project and run whenever dbt run is executed in any environment it is in. You're now on your way to becoming an expert in data transformation!
